

Question: You need to create a sonified graph to allow users who are blind to compare the temperature for a given week to those exactly one
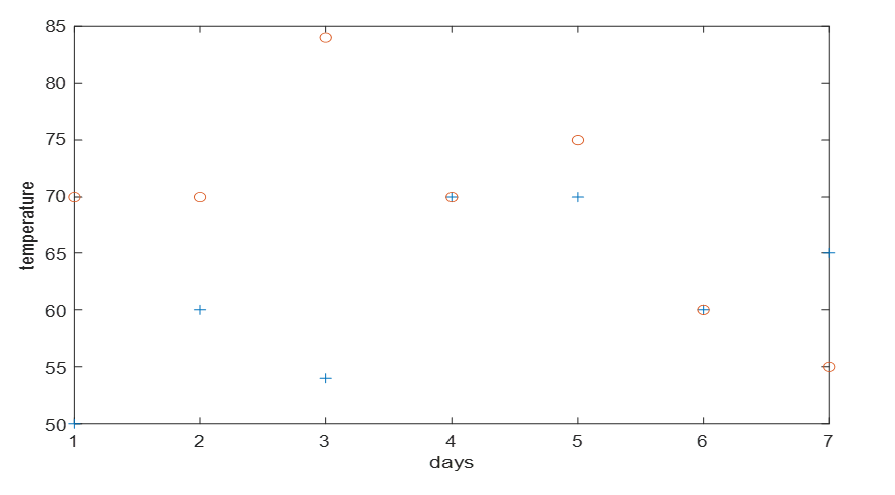
You need to create a sonified graph to allow users who are blind to compare the temperature for a given week to those exactly one year ago. Below shows the visual version of the graph where the red circles are the current year and the blue crosses are the previous year You need to make an appropriate sonified version.
The temperatures can range from to F
The function that you will create to do this will be passed two vectors of data points each. The first will be from the current year and the second will be from the previous year.
I should be able to use the function with different parameters from the MATLAB command line. Also answer the following:
What data dimensions do you need to portray? What type of dimension ie nominal, ordinal, scalar is each dimension?
What is the nature of the mapping from data dimensions to display dimensions? What about polarity? Scaling?
What about masking?
What about dimension interactions?
Step by Step Solution
There are 3 Steps involved in it
1 Expert Approved Answer
Step: 1 Unlock

Question Has Been Solved by an Expert!
Get step-by-step solutions from verified subject matter experts
Step: 2 Unlock
Step: 3 Unlock