

Question: You received partial credit in the previous attempt. Column H Gross Margin = Sales Price - Cost Column I Gross Margin Percentage = Gross Margin
You received partial credit in the previous attempt.
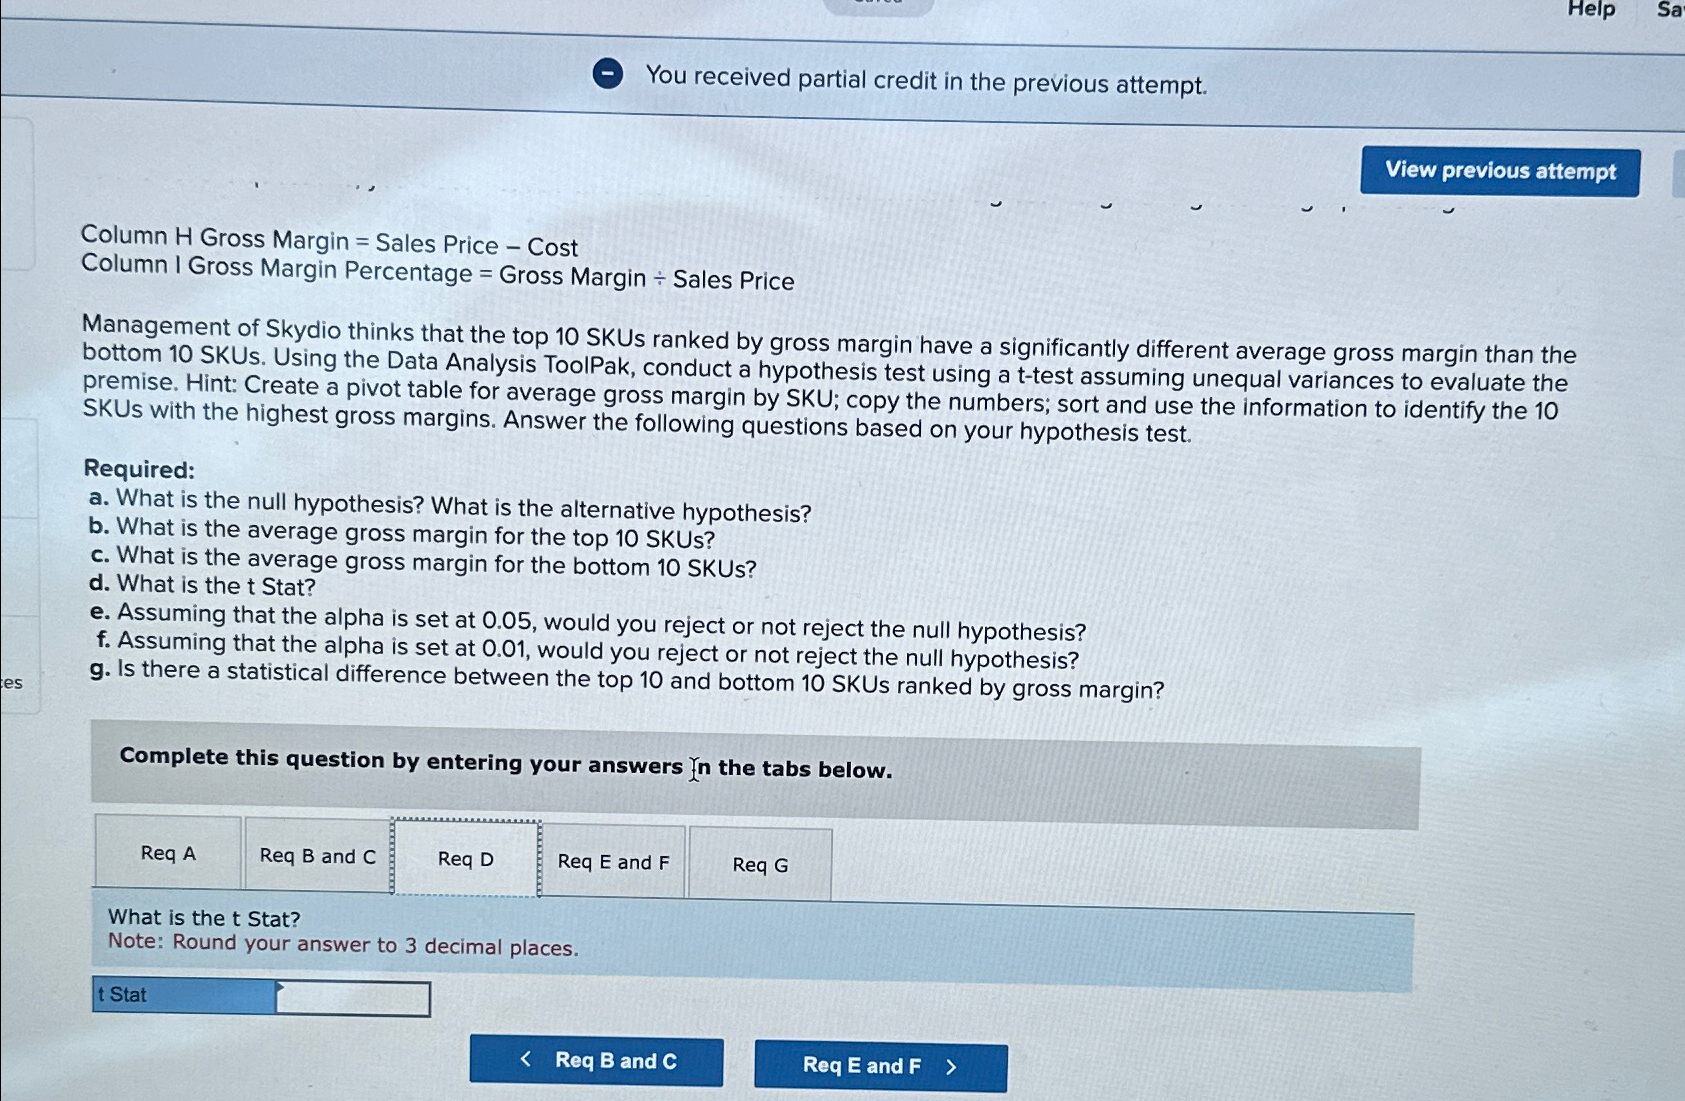
Column H Gross Margin Sales Price Cost
Column I Gross Margin Percentage Gross Margin Sales Price
Management of Skydio thinks that the top SKUs ranked by gross margin have a significantly different average gross margin than the bottom SKUs. Using the Data Analysis ToolPak, conduct a hypothesis test using a ttest assuming unequal variances to evaluate the premise. Hint: Create a pivot table for average gross margin by SKU; copy the numbers; sort and use the information to identify the SKUs with the highest gross margins. Answer the following questions based on your hypothesis test.
Required:
a What is the null hypothesis? What is the alternative hypothesis?
b What is the average gross margin for the top SKUs?
c What is the average gross margin for the bottom SKUs?
d What is the Stat?
e Assuming that the alpha is set at would you reject or not reject the null hypothesis?
f Assuming that the alpha is set at would you reject or not reject the null hypothesis?
g Is there a statistical difference between the top and bottom SKUs ranked by gross margin?
Complete this question by entering your answers Yn the tabs below.
Req and
Req D
Req and
What is the Stat?
Note: Round your answer to decimal places.
t Stat
Step by Step Solution
There are 3 Steps involved in it
1 Expert Approved Answer
Step: 1 Unlock

Question Has Been Solved by an Expert!
Get step-by-step solutions from verified subject matter experts
Step: 2 Unlock
Step: 3 Unlock