

Question: You run a reaction and graph the following data. When you generate the trendline, it is y= 1.233103x+0.293. What is the concentration of the reactant
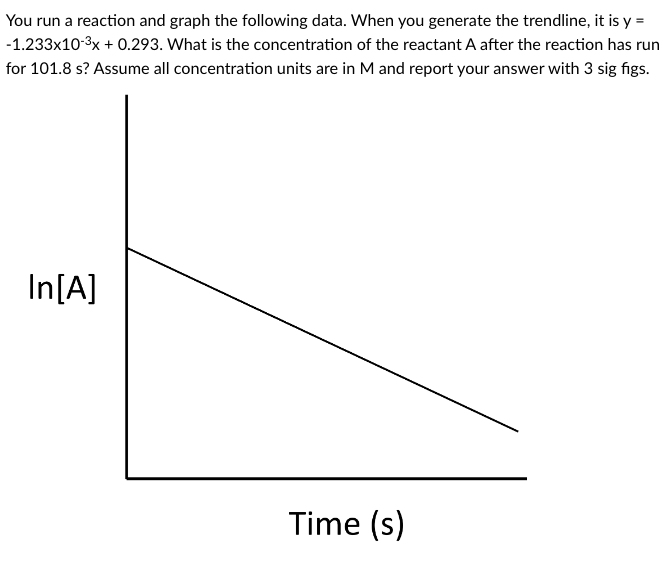
You run a reaction and graph the following data. When you generate the trendline, it is y= 1.233103x+0.293. What is the concentration of the reactant A after the reaction has run for 101.8s ? Assume all concentration units are in M and report your answer with 3 sig figs. IIII 101
Step by Step Solution
There are 3 Steps involved in it
1 Expert Approved Answer
Step: 1 Unlock

Question Has Been Solved by an Expert!
Get step-by-step solutions from verified subject matter experts
Step: 2 Unlock
Step: 3 Unlock