

Question: You run a regression for a stock's return on a market index and find the following Excel output: table [ [ Multiple R ,
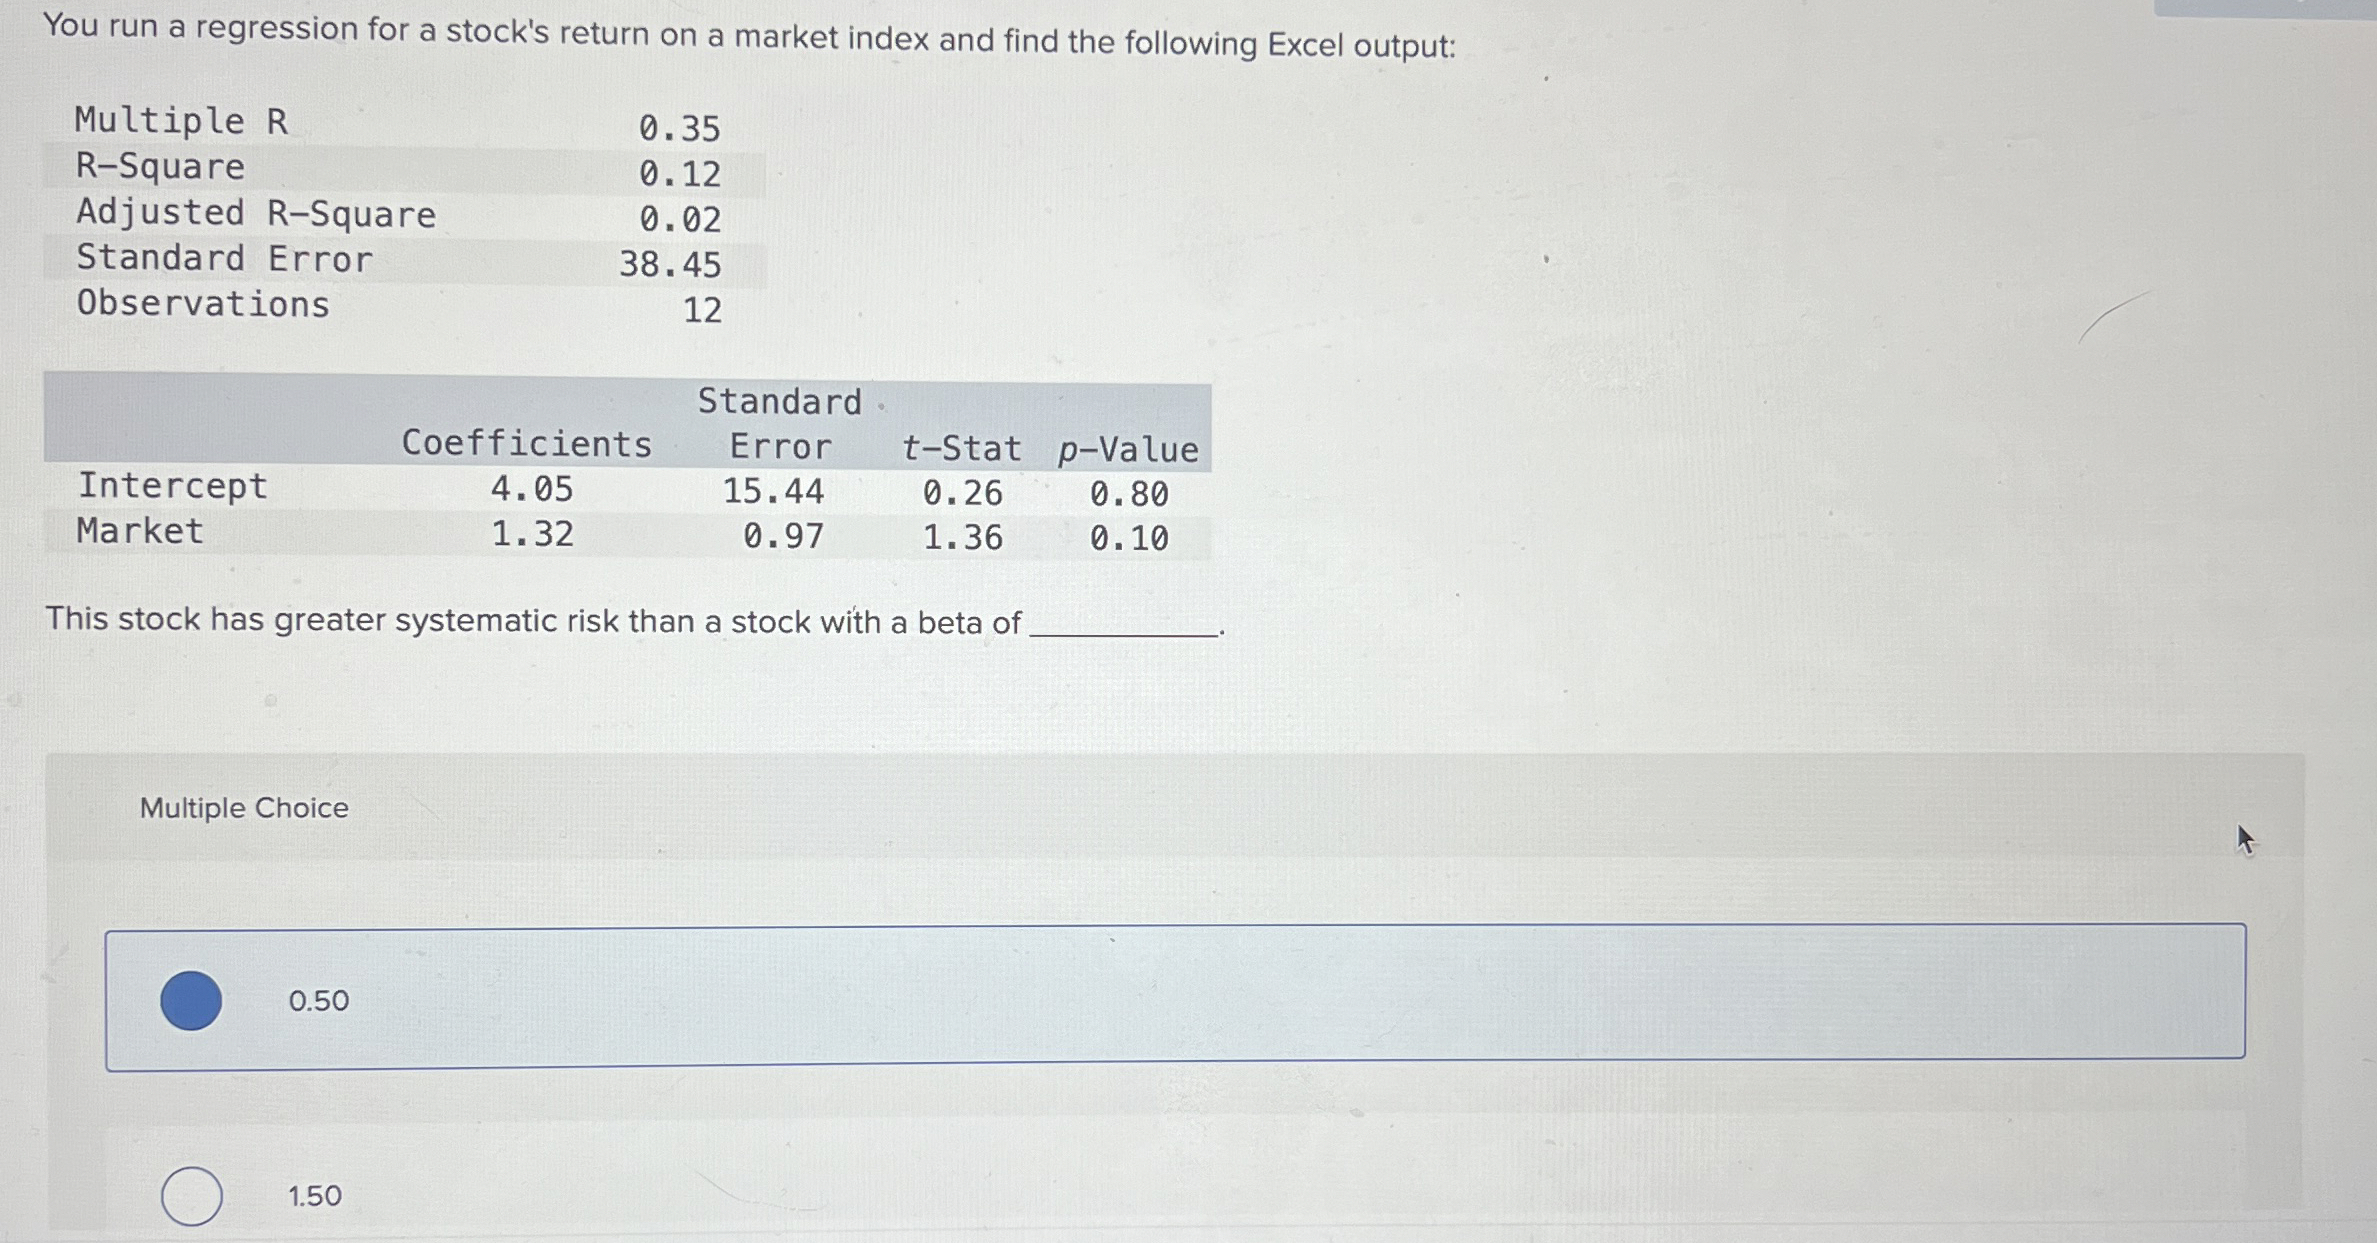
You run a regression for a stock's return on a market index and find the following Excel output:
tableMultiple RRSquare,Adjusted RSquare,Standard Error,Observations
tableStandardInterceptCoefficients,Error,tStat,pValueMarket
This stock has greater systematic risk than a stock with a beta of
Multiple Choice
Step by Step Solution
There are 3 Steps involved in it
1 Expert Approved Answer
Step: 1 Unlock

Question Has Been Solved by an Expert!
Get step-by-step solutions from verified subject matter experts
Step: 2 Unlock
Step: 3 Unlock