Question: You see a network for a project's activities. The activities are A, B, C, D, E, F, G, and their activity times are shown next
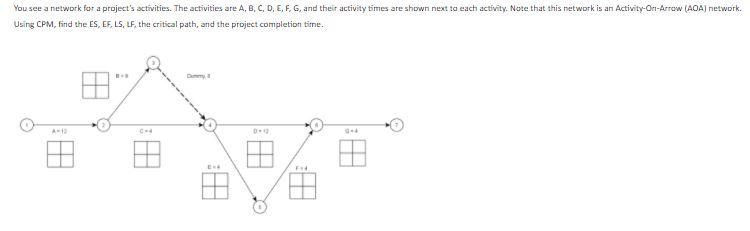
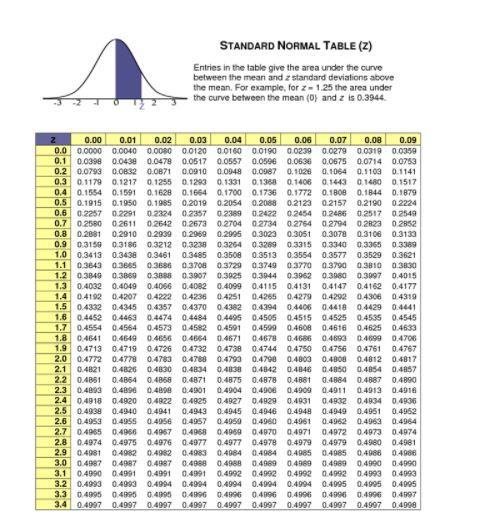
You see a network for a project's activities. The activities are A, B, C, D, E, F, G, and their activity times are shown next to each activity. Note that this network is an Activity-On-Arrow (AOA) network. Using CPM, find the ES, EE, LS, LF, the critical path, and the project completion time. STANDARD NORMAL TABLE (2) Entries in the table give the area under the curve between the mean and standard deviations above the mean. For example, for 2-1.25 the area under the curve between the mean (O) and z is 0.3944. 0.00 0.01 0.02 0.03 0.04 0.05 0.06 0.07 0.08 0.09 0.0 0.0000 0.0040 0.000 0.0120 00160 0.0190 0.0239 0.0279 0.0319 0.0359 0.1 0.0398 0.0438 0.0478 0.0517 0.0557 0.0596 0.0636 0.0675 0.0714 0.0753 0.2 0.0793 0.0832 0.0871 0.0910 0.0948 0.0987 0.1026 0.1064 0.1103 0.1141 0.3 0.1179 0.1217 0.1255 0.1293 0.1331 0.1388 0.1406 01443 0.1480 0.1517 0.4 0.1554 0.1591 0.1628 0.1664 0.1700 0.1736 0.1772 0.1808 0.1844 0.1879 0.5 0.1915 0.1950 0.1985 0.2019 0.2054 0.2088 0.2123 0.2157 0.2190 0.2224 0.6 0.2257 0.2291 0.2324 0.2357 02389 0.2422 0.2454 0.2486 0.251702549 0.7 0.2580 02611 02642 0.2673 02704 02734 0.2754 0.2794 0.2823 0.2852 0.8 0.2881 0.2910 0.2939 0.2969 0.2995 0.3023 0.3051 0.3078 0.3106 0.3130 0.9 0.3159 0.3186 0.3212 0.3238 03254 0.3289 0.3315 0.334003365 0.3389 1.0 0.3413 0.3438 0.3481 0.3485 0.3508 0.3513 0.3554 0.3577 0.3529 0.3621 1.1 0.3643 0.3865 0.3686 0370803729 03749 03770 0.3790 0.3810 0.30:30 1.2 0.3840 0.3869 03888 03907 0.3925 0.3944 0.3962 0.3980 0.3997 0.4015 1.3 0.4032 0.4049 0.4056 0.4082 0.4099 0.4115 0.4131 0.4147 0.4162 0.4177 1.4 0.4192 0.4207 0.4222 0.4236 04251 0.4265 0.4279 0.4292 0.4306 0.4319 1.5 0.4332 0.4345 0.4357 0.4370 0.4382 0.4394 0.4406 0.4419 0.4429 0.4441 1.6 0.4452 0.4463 0.4474 0.4484 0.4495 0.4505 0.4515 0.4525 0.4535 0.4545 1.7 0.4554 0.4564 0.4573 0.4582 0.4591 0.4599 0.4608 0.4616 0.4625 0.4633 1.8 0.4641 0.4649 0.4656 0.4864 0.4671 0.4678 0.4686 0.4693 0.4699 0.4706 1.9 0.4713 0.4719 0.4726 0.4732 0.4738 0.4744 0.4750 0.4756 0.4761 0.4767 2.0 0.4772 0.4778 0.4783 0.4788 0.4793 0.4790 0.4803 0.4808 0.4812 0.4817 2.1 0.4821 0.4826 0.4830 0.4834 0.4838 0.4842 0.4846 0.4850 0.4854 0.4857 2.2 0.4851 0.4864 0.4858 0.4871 0.4875 0.4878 0.4881 0.4884 0.4887 0.4890 2.3 0.4893 0.48.96 0.4890 0.4901 0.4904 0.4908 0.4909 0.4911 0.4913 0.4916 2.4 0.4918 0.4920 0.492204925 0.4927 0.49290.4931 0.4932 0.4934 0.4936 2.5 0.4939 0.4940 0.4941 0.4943 0.4945 0.4946 0.4948 0.4949 0.4951 0.4952 2.6 0.4953 0.4955 0.4956 0.4957 0.4950 0.4960 0.4981 0.4962 0.4963 0.4964 2.7 0.4965 0.4956 0.4957 0.4968 0.4969 0.4970 0.4971 0.4972 0.4973 0.4074 2.8 0.4974 0.4975 0.4976 0.4977 0.49770.4978 0.4979 0.4979 0.4980 0.4981 2.9 0.4981 0.4982 0.4982 0.4983 0.4084 0.4984 0.4985 0.4985 0.4988 0.4988 3.0 0.4987 0.4987 0.4987 0.4988 0.4988 0.4080 0.4989 0.4989 0.4990 0.491 3.1 0.4990 0.4991 0.4991 0.4991 0.4992 0.4992 0.4992 04992 0.4993 0.4993 3.2 0.4933 0.4993 0.4994 0.4994 0.4994 0.4994 0.4994 0.4995 0.4995 0.4095 3.3 0.4095 0.4890 0.4895 0.4996 0.4996 0.4896 0.4096 0.4996 0.499 0.4097 3.4 0.4097 0.4997 0.4097 0.4997 0.4997 0.4997 0.4997 0.4997 0.4997 0.4998 You see a network for a project's activities. The activities are A, B, C, D, E, F, G, and their activity times are shown next to each activity. Note that this network is an Activity-On-Arrow (AOA) network. Using CPM, find the ES, EE, LS, LF, the critical path, and the project completion time. STANDARD NORMAL TABLE (2) Entries in the table give the area under the curve between the mean and standard deviations above the mean. For example, for 2-1.25 the area under the curve between the mean (O) and z is 0.3944. 0.00 0.01 0.02 0.03 0.04 0.05 0.06 0.07 0.08 0.09 0.0 0.0000 0.0040 0.000 0.0120 00160 0.0190 0.0239 0.0279 0.0319 0.0359 0.1 0.0398 0.0438 0.0478 0.0517 0.0557 0.0596 0.0636 0.0675 0.0714 0.0753 0.2 0.0793 0.0832 0.0871 0.0910 0.0948 0.0987 0.1026 0.1064 0.1103 0.1141 0.3 0.1179 0.1217 0.1255 0.1293 0.1331 0.1388 0.1406 01443 0.1480 0.1517 0.4 0.1554 0.1591 0.1628 0.1664 0.1700 0.1736 0.1772 0.1808 0.1844 0.1879 0.5 0.1915 0.1950 0.1985 0.2019 0.2054 0.2088 0.2123 0.2157 0.2190 0.2224 0.6 0.2257 0.2291 0.2324 0.2357 02389 0.2422 0.2454 0.2486 0.251702549 0.7 0.2580 02611 02642 0.2673 02704 02734 0.2754 0.2794 0.2823 0.2852 0.8 0.2881 0.2910 0.2939 0.2969 0.2995 0.3023 0.3051 0.3078 0.3106 0.3130 0.9 0.3159 0.3186 0.3212 0.3238 03254 0.3289 0.3315 0.334003365 0.3389 1.0 0.3413 0.3438 0.3481 0.3485 0.3508 0.3513 0.3554 0.3577 0.3529 0.3621 1.1 0.3643 0.3865 0.3686 0370803729 03749 03770 0.3790 0.3810 0.30:30 1.2 0.3840 0.3869 03888 03907 0.3925 0.3944 0.3962 0.3980 0.3997 0.4015 1.3 0.4032 0.4049 0.4056 0.4082 0.4099 0.4115 0.4131 0.4147 0.4162 0.4177 1.4 0.4192 0.4207 0.4222 0.4236 04251 0.4265 0.4279 0.4292 0.4306 0.4319 1.5 0.4332 0.4345 0.4357 0.4370 0.4382 0.4394 0.4406 0.4419 0.4429 0.4441 1.6 0.4452 0.4463 0.4474 0.4484 0.4495 0.4505 0.4515 0.4525 0.4535 0.4545 1.7 0.4554 0.4564 0.4573 0.4582 0.4591 0.4599 0.4608 0.4616 0.4625 0.4633 1.8 0.4641 0.4649 0.4656 0.4864 0.4671 0.4678 0.4686 0.4693 0.4699 0.4706 1.9 0.4713 0.4719 0.4726 0.4732 0.4738 0.4744 0.4750 0.4756 0.4761 0.4767 2.0 0.4772 0.4778 0.4783 0.4788 0.4793 0.4790 0.4803 0.4808 0.4812 0.4817 2.1 0.4821 0.4826 0.4830 0.4834 0.4838 0.4842 0.4846 0.4850 0.4854 0.4857 2.2 0.4851 0.4864 0.4858 0.4871 0.4875 0.4878 0.4881 0.4884 0.4887 0.4890 2.3 0.4893 0.48.96 0.4890 0.4901 0.4904 0.4908 0.4909 0.4911 0.4913 0.4916 2.4 0.4918 0.4920 0.492204925 0.4927 0.49290.4931 0.4932 0.4934 0.4936 2.5 0.4939 0.4940 0.4941 0.4943 0.4945 0.4946 0.4948 0.4949 0.4951 0.4952 2.6 0.4953 0.4955 0.4956 0.4957 0.4950 0.4960 0.4981 0.4962 0.4963 0.4964 2.7 0.4965 0.4956 0.4957 0.4968 0.4969 0.4970 0.4971 0.4972 0.4973 0.4074 2.8 0.4974 0.4975 0.4976 0.4977 0.49770.4978 0.4979 0.4979 0.4980 0.4981 2.9 0.4981 0.4982 0.4982 0.4983 0.4084 0.4984 0.4985 0.4985 0.4988 0.4988 3.0 0.4987 0.4987 0.4987 0.4988 0.4988 0.4080 0.4989 0.4989 0.4990 0.491 3.1 0.4990 0.4991 0.4991 0.4991 0.4992 0.4992 0.4992 04992 0.4993 0.4993 3.2 0.4933 0.4993 0.4994 0.4994 0.4994 0.4994 0.4994 0.4995 0.4995 0.4095 3.3 0.4095 0.4890 0.4895 0.4996 0.4996 0.4896 0.4096 0.4996 0.499 0.4097 3.4 0.4097 0.4997 0.4097 0.4997 0.4997 0.4997 0.4997 0.4997 0.4997 0.4998


