

Question: You want to define control limits, UCL and LCL, for a X-bar Chart to control the diameter of cylinder rails. You collected 30 samples
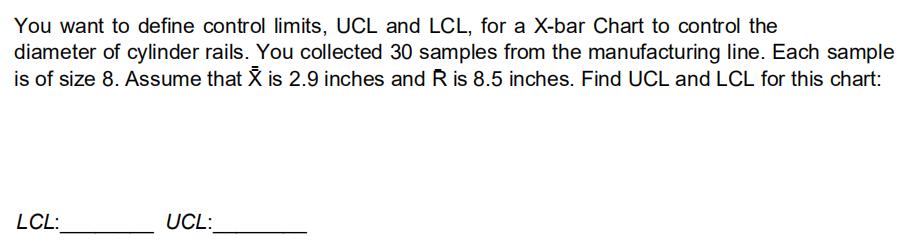
You want to define control limits, UCL and LCL, for a X-bar Chart to control the diameter of cylinder rails. You collected 30 samples from the manufacturing line. Each sample is of size 8. Assume that X is 2.9 inches and R is 8.5 inches. Find UCL and LCL for this chart: LCL: UCL:
Step by Step Solution
There are 3 Steps involved in it
1 Expert Approved Answer
Step: 1 Unlock

Absolutely control limits for an Xbar chart help monitor the process average center line and identif... View full answer
Question Has Been Solved by an Expert!
Get step-by-step solutions from verified subject matter experts
Step: 2 Unlock
Step: 3 Unlock