

Question: You will apply the statistical concepts and techniques covered in this week's reading about multiple regression. Last week's discussion involved a car rental company that
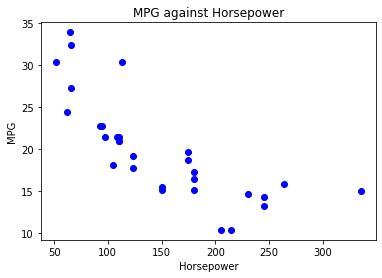
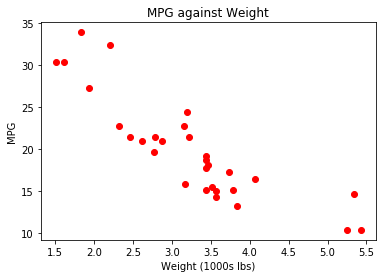
You will apply the statistical concepts and techniques covered in this week's reading about multiple regression. Last week's discussion involved a car rental company that wanted to evaluate the premise that heavier cars are less fuel efficient than lighter cars. The company expected fuel efficiency (miles per gallon) and weight of the car (often measured in thousands of pounds) to be correlated. The company also expects cars with higher horsepower to be less fuel efficient than cars with lower horsepower. They would like you to consider this new variable in your analysis.
You will work with a cars data set that includes the three variables used in this discussion:
- Miles per gallon (coded as mpg in the data set)
- Weight of the car (coded as wt in the data set)
- Horsepower (coded as hp in the data set)
Address the following items:
- Check to be sure your scatterplots of miles per gallon against horsepower and weight of the car were included in your attachment. Do the plots show any trend? If yes, is the trend what you expected? Why or why not? See Steps 2 and 3 in the Python script.
- What are the coefficients of correlation between miles per gallon and horsepower? Between miles per gallon and the weight of the car? What are the directions and strengths of these coefficients? Do the coefficients of correlation indicate a strong correlation, weak correlation, or no correlation between these variables? See Step 4 in the Python script.
- Write the multiple regression equation for miles per gallon as the response variable. Use weight and horsepower as predictor variables. See Step 5 in the Python script. How might the car rental company use this model?
This is my data:
Step 1.
Cars data frame (showing only the first five observations)
| Unnamed: 0 | mpg | cyl | disp | hp | drat | wt | qsec | vs | am | gear | carb | |
|---|---|---|---|---|---|---|---|---|---|---|---|---|
| 22 | AMC Javelin | 15.2 | 8 | 304.0 | 150 | 3.15 | 3.435 | 17.30 | 0 | 0 | 3 | 2 |
| 21 | Dodge Challenger | 15.5 | 8 | 318.0 | 150 | 2.76 | 3.520 | 16.87 | 0 | 0 | 3 | 2 |
| 20 | Toyota Corona | 21.5 | 4 | 120.1 | 97 | 3.70 | 2.465 | 20.01 | 1 | 0 | 3 | 1 |
| 18 | Honda Civic | 30.4 | 4 | 75.7 | 52 | 4.93 | 1.615 | 18.52 | 1 | 1 | 4 | 2 |
| 25 | Fiat X1-9 | 27.3 | 4 | 79.0 | 66 | 4.08 | 1.935 | 18.90 | 1 | 1 | 4 | 1 |
Step 2.
Step by Step Solution
There are 3 Steps involved in it

Get step-by-step solutions from verified subject matter experts