Question: You will be using the data in the files FBODY 2.pdf and MBODY 2.pdf. From FBODY2.pdf and MBODY 2.pdf choose the same variable for males
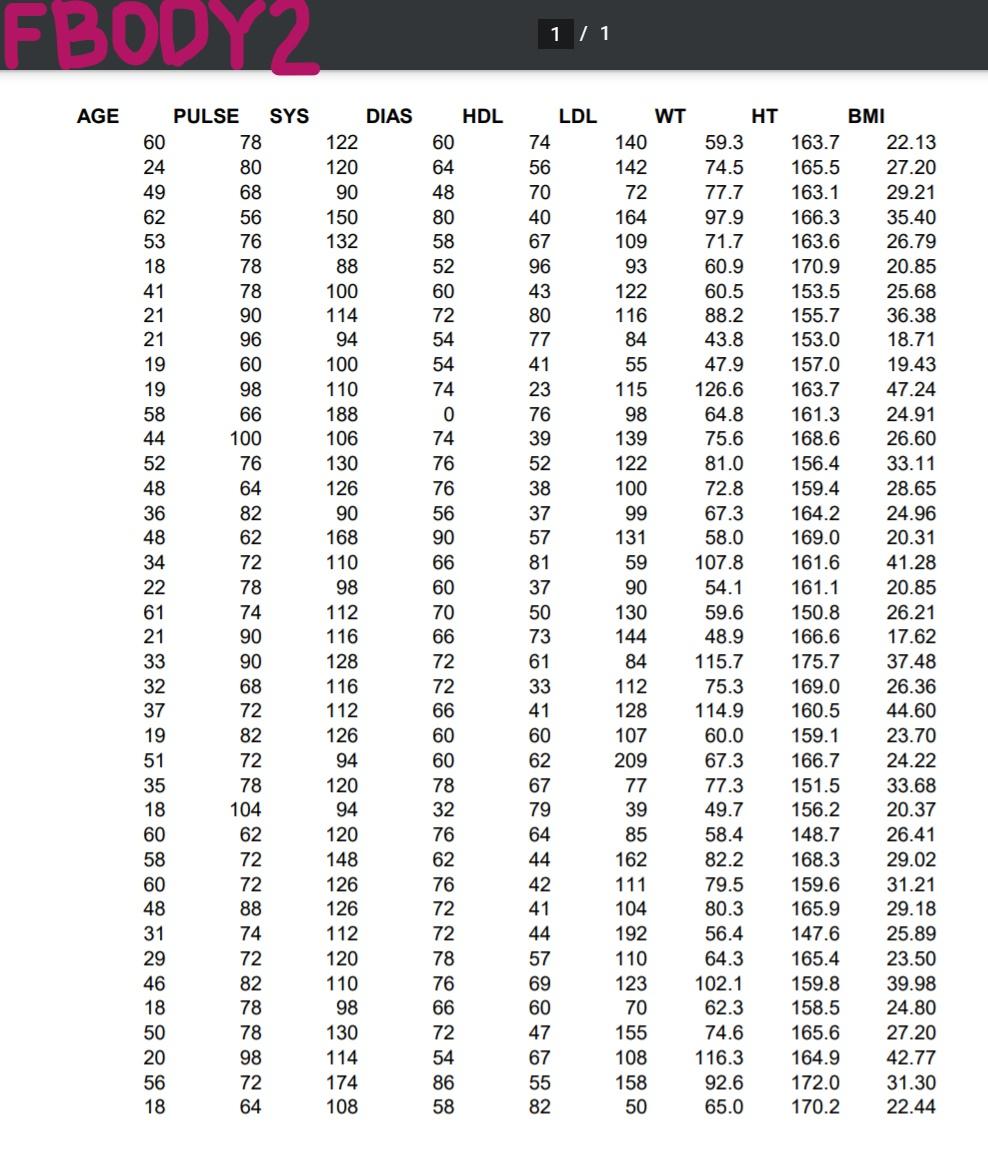
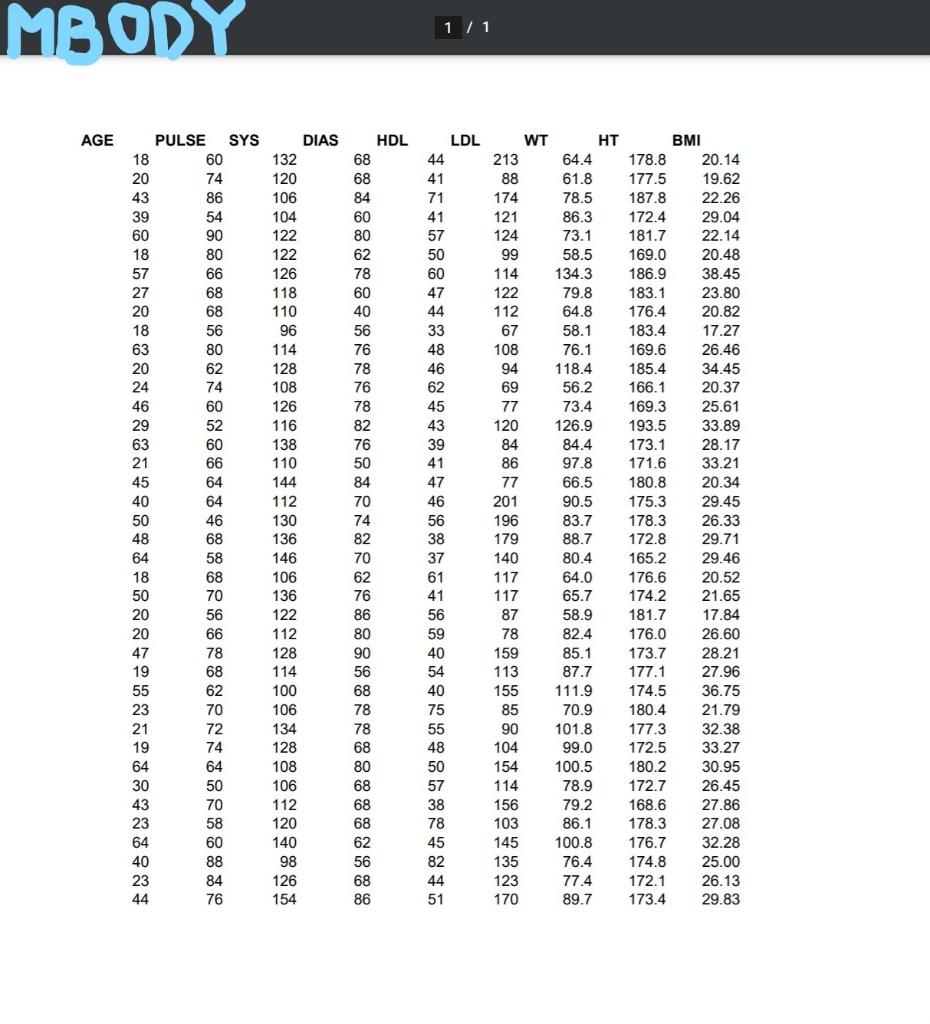
You will be using the data in the files FBODY 2.pdf and MBODY 2.pdf. From FBODY2.pdf and MBODY 2.pdf choose the same variable for males and females. The variables are described below. For example, you could choose the weight variable for each group, or the BMI, or the HDL variable. Tell me what you chose. 1. Hypothesis Testing for the Difference of Population Means a. Write, in both sentence form and symbolic form, null hypothesis and alternative hypothesis for deciding: is there a difference between males and females for the population means of the variable you selected? b. Is this a left-tailed, right-tailed, or two-tailed test? c. Explain why you believe the normality criteria are valid for your chosen data. d. Calculate the sample mean, x, sample standard deviation, s, and the sample size, n, for the variable for both the females and for the males. (XM, Sm, and nm as well as Xp, Sp, and np). e. Calculate the difference of sample means, XM - Xf, su + sand the t-score for your difference from f. Calculate the standard error o = + VnM ng (XM-if)-(um-up) part e: t = o g. Calculate the p-value for your hypothesis test. To do this, select the correct df for the variable you chose using the degrees of freedom table below, and use the tcdf function on the TI calculator. h. Choose a level of significance, say 0.05, 0.02, or 0.01. Should you reject or not reject the null hypothesis? i. Explain, in terms a non-statistics person would understand, your conclusion from part h, explaining what it tells us about the difference in population means for this variable for adult males and females. FBODY. 1 / 1 AGE 97.9 PULSE SYS 60 78 24 80 49 68 62 56 53 76 18 78 41 78 21 90 21 96 19 60 19 98 58 66 44 100 52 76 48 64 36 82 48 62 34 72 22 78 61 74 21 90 33 90 32 68 37 72 19 82 51 72 35 78 18 104 60 62 58 72 60 72 48 88 31 74 29 72 46 82 18 78 50 78 20 98 56 72 18 64 DIAS 122 120 90 150 132 88 100 114 94 100 110 188 106 130 126 90 168 110 98 112 116 128 116 112 126 94 120 94 120 148 126 126 112 120 110 98 130 114 174 108 HDL 60 64 48 80 58 52 60 72 54 54 74 0 74 76 76 56 90 66 60 70 66 72 72 66 60 60 78 32 76 62 76 72 72 78 76 66 72 54 86 58 LDL 74 56 70 40 67 96 43 80 77 41 23 76 39 52 38 37 57 81 37 50 73 61 33 41 60 62 67 79 64 44 42 41 44 57 69 60 47 67 55 82 WT HT BMI 140 59.3 163.7 22.13 142 74.5 165.5 27.20 72 77.7 163.1 29.21 164 166.3 35.40 109 71.7 163.6 26.79 93 60.9 170.9 20.85 122 60.5 153.5 25.68 116 88.2 155.7 36.38 84 43.8 153.0 18.71 55 47.9 157.0 19.43 115 126.6 163.7 47.24 98 64.8 161.3 24.91 139 75.6 168.6 26.60 122 81.0 156.4 33.11 100 72.8 159.4 28.65 99 67.3 164.2 24.96 131 58.0 169.0 20.31 59 107.8 161.6 41.28 90 54.1 161.1 20.85 130 59.6 150.8 26.21 144 48.9 166.6 17.62 84 115.7 175.7 37.48 112 75.3 169.0 26.36 128 114.9 160.5 44.60 107 60.0 159.1 23.70 209 67.3 166.7 24.22 77 77.3 151.5 33.68 39 49.7 156.2 20.37 85 58.4 148.7 26.41 162 82.2 168.3 29.02 111 79.5 159.6 31.21 104 80.3 165.9 29.18 192 56.4 147.6 25.89 110 64.3 165.4 23.50 123 102.1 159.8 39.98 70 62.3 158.5 24.80 155 74.6 165.6 27.20 116.3 164.9 42.77 158 92.6 172.0 31.30 50 65.0 170.2 22.44 108 MBODY 1 / 1 AGE DIAS 132 120 106 104 122 122 126 HDL 68 68 84 60 80 62 78 60 40 56 76 78 76 78 82 76 PULSE SYS 18 60 20 74 43 86 39 54 60 90 18 80 57 66 27 68 20 68 18 56 63 80 20 62 24 74 46 60 29 52 63 60 21 66 45 64 40 64 50 46 48 68 64 58 18 68 50 70 20 56 20 66 47 78 19 68 55 62 23 70 21 72 19 74 64 64 30 50 43 70 23 58 64 60 40 88 23 84 44 76 118 110 96 114 128 108 126 116 138 110 144 112 130 136 146 106 136 122 112 128 114 100 106 134 128 108 106 112 120 140 98 126 154 84 70 74 82 70 62 76 86 80 90 56 68 78 78 68 80 68 68 68 62 56 68 86 LDL 44 41 71 41 57 50 60 47 44 33 48 46 62 45 43 39 41 47 46 56 38 37 61 41 56 59 40 54 40 75 55 48 50 57 38 78 45 82 44 51 WT HT BMI 213 64.4 178.8 20.14 88 61.8 177.5 19.62 174 78.5 187.8 22.26 121 86.3 172.4 29.04 124 73.1 181.7 22.14 99 58.5 169.0 20.48 114 134.3 186.9 38.45 122 79.8 183.1 23.80 112 64.8 176.4 20.82 67 58.1 183.4 17.27 108 76.1 169.6 26.46 94 118.4 185.4 34.45 69 56.2 166.1 20.37 77 73.4 169.3 25.61 120 126.9 193.5 33.89 84 84.4 173.1 28.17 86 97.8 171.6 33.21 77 66.5 180.8 20.34 201 90.5 175.3 29.45 196 83.7 178.3 26.33 179 88.7 172.8 29.71 140 80.4 165.2 29.46 117 64.0 176.6 20.52 117 65.7 174.2 21.65 87 58.9 181.7 17.84 78 82.4 176.0 26.60 159 85.1 173.7 28.21 113 87.7 177.1 27.96 155 111.9 174.5 36.75 85 70.9 180.4 21.79 90 101.8 177.3 32.38 104 99.0 172.5 33.27 154 100.5 180.2 30.95 114 78.9 172.7 26.45 156 79.2 168.6 27.86 103 86.1 178.3 27.08 145 100.8 176.7 32.28 135 76.4 174.8 25.00 123 77.4 172.1 26.13 170 89.7 173.4 29.83 You will be using the data in the files FBODY 2.pdf and MBODY 2.pdf. From FBODY2.pdf and MBODY 2.pdf choose the same variable for males and females. The variables are described below. For example, you could choose the weight variable for each group, or the BMI, or the HDL variable. Tell me what you chose. 1. Hypothesis Testing for the Difference of Population Means a. Write, in both sentence form and symbolic form, null hypothesis and alternative hypothesis for deciding: is there a difference between males and females for the population means of the variable you selected? b. Is this a left-tailed, right-tailed, or two-tailed test? c. Explain why you believe the normality criteria are valid for your chosen data. d. Calculate the sample mean, x, sample standard deviation, s, and the sample size, n, for the variable for both the females and for the males. (XM, Sm, and nm as well as Xp, Sp, and np). e. Calculate the difference of sample means, XM - Xf, su + sand the t-score for your difference from f. Calculate the standard error o = + VnM ng (XM-if)-(um-up) part e: t = o g. Calculate the p-value for your hypothesis test. To do this, select the correct df for the variable you chose using the degrees of freedom table below, and use the tcdf function on the TI calculator. h. Choose a level of significance, say 0.05, 0.02, or 0.01. Should you reject or not reject the null hypothesis? i. Explain, in terms a non-statistics person would understand, your conclusion from part h, explaining what it tells us about the difference in population means for this variable for adult males and females. FBODY. 1 / 1 AGE 97.9 PULSE SYS 60 78 24 80 49 68 62 56 53 76 18 78 41 78 21 90 21 96 19 60 19 98 58 66 44 100 52 76 48 64 36 82 48 62 34 72 22 78 61 74 21 90 33 90 32 68 37 72 19 82 51 72 35 78 18 104 60 62 58 72 60 72 48 88 31 74 29 72 46 82 18 78 50 78 20 98 56 72 18 64 DIAS 122 120 90 150 132 88 100 114 94 100 110 188 106 130 126 90 168 110 98 112 116 128 116 112 126 94 120 94 120 148 126 126 112 120 110 98 130 114 174 108 HDL 60 64 48 80 58 52 60 72 54 54 74 0 74 76 76 56 90 66 60 70 66 72 72 66 60 60 78 32 76 62 76 72 72 78 76 66 72 54 86 58 LDL 74 56 70 40 67 96 43 80 77 41 23 76 39 52 38 37 57 81 37 50 73 61 33 41 60 62 67 79 64 44 42 41 44 57 69 60 47 67 55 82 WT HT BMI 140 59.3 163.7 22.13 142 74.5 165.5 27.20 72 77.7 163.1 29.21 164 166.3 35.40 109 71.7 163.6 26.79 93 60.9 170.9 20.85 122 60.5 153.5 25.68 116 88.2 155.7 36.38 84 43.8 153.0 18.71 55 47.9 157.0 19.43 115 126.6 163.7 47.24 98 64.8 161.3 24.91 139 75.6 168.6 26.60 122 81.0 156.4 33.11 100 72.8 159.4 28.65 99 67.3 164.2 24.96 131 58.0 169.0 20.31 59 107.8 161.6 41.28 90 54.1 161.1 20.85 130 59.6 150.8 26.21 144 48.9 166.6 17.62 84 115.7 175.7 37.48 112 75.3 169.0 26.36 128 114.9 160.5 44.60 107 60.0 159.1 23.70 209 67.3 166.7 24.22 77 77.3 151.5 33.68 39 49.7 156.2 20.37 85 58.4 148.7 26.41 162 82.2 168.3 29.02 111 79.5 159.6 31.21 104 80.3 165.9 29.18 192 56.4 147.6 25.89 110 64.3 165.4 23.50 123 102.1 159.8 39.98 70 62.3 158.5 24.80 155 74.6 165.6 27.20 116.3 164.9 42.77 158 92.6 172.0 31.30 50 65.0 170.2 22.44 108 MBODY 1 / 1 AGE DIAS 132 120 106 104 122 122 126 HDL 68 68 84 60 80 62 78 60 40 56 76 78 76 78 82 76 PULSE SYS 18 60 20 74 43 86 39 54 60 90 18 80 57 66 27 68 20 68 18 56 63 80 20 62 24 74 46 60 29 52 63 60 21 66 45 64 40 64 50 46 48 68 64 58 18 68 50 70 20 56 20 66 47 78 19 68 55 62 23 70 21 72 19 74 64 64 30 50 43 70 23 58 64 60 40 88 23 84 44 76 118 110 96 114 128 108 126 116 138 110 144 112 130 136 146 106 136 122 112 128 114 100 106 134 128 108 106 112 120 140 98 126 154 84 70 74 82 70 62 76 86 80 90 56 68 78 78 68 80 68 68 68 62 56 68 86 LDL 44 41 71 41 57 50 60 47 44 33 48 46 62 45 43 39 41 47 46 56 38 37 61 41 56 59 40 54 40 75 55 48 50 57 38 78 45 82 44 51 WT HT BMI 213 64.4 178.8 20.14 88 61.8 177.5 19.62 174 78.5 187.8 22.26 121 86.3 172.4 29.04 124 73.1 181.7 22.14 99 58.5 169.0 20.48 114 134.3 186.9 38.45 122 79.8 183.1 23.80 112 64.8 176.4 20.82 67 58.1 183.4 17.27 108 76.1 169.6 26.46 94 118.4 185.4 34.45 69 56.2 166.1 20.37 77 73.4 169.3 25.61 120 126.9 193.5 33.89 84 84.4 173.1 28.17 86 97.8 171.6 33.21 77 66.5 180.8 20.34 201 90.5 175.3 29.45 196 83.7 178.3 26.33 179 88.7 172.8 29.71 140 80.4 165.2 29.46 117 64.0 176.6 20.52 117 65.7 174.2 21.65 87 58.9 181.7 17.84 78 82.4 176.0 26.60 159 85.1 173.7 28.21 113 87.7 177.1 27.96 155 111.9 174.5 36.75 85 70.9 180.4 21.79 90 101.8 177.3 32.38 104 99.0 172.5 33.27 154 100.5 180.2 30.95 114 78.9 172.7 26.45 156 79.2 168.6 27.86 103 86.1 178.3 27.08 145 100.8 176.7 32.28 135 76.4 174.8 25.00 123 77.4 172.1 26.13 170 89.7 173.4 29.83


