

Question: You will find a template with data on annual stock prices for Kellogg and Ford for 1995 and 2014. a. Graph the annual stock returns
You will find a template with data on annual stock prices for Kellogg and Ford for 1995 and 2014. a. Graph the annual stock returns of Kellogg and Ford on the same graph. b. Compute the annual average return and the standard deviation of annual returns for Kellogg and Ford. Please write down the formula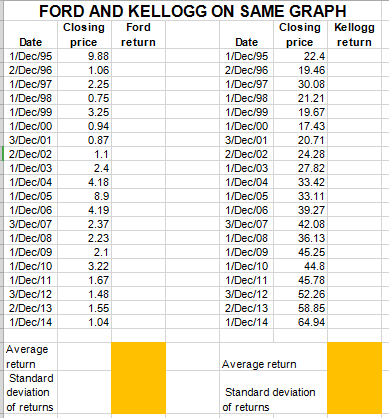
FORD AND KELLOGG ON SAME GRAPH Closing Kellogg price return Closing Ford return price 1/Dec/97 1/Dec/98 1/Dec/00 1/Dec/04 1/Dec/04 1/Dec/06 Average Standard Standard deviation
Step by Step Solution
There are 3 Steps involved in it
1 Expert Approved Answer
Step: 1 Unlock

Question Has Been Solved by an Expert!
Get step-by-step solutions from verified subject matter experts
Step: 2 Unlock
Step: 3 Unlock