

Question: You will have to use R - studio in order to see. Consider the following output ( of the f p p 2 package you
You will have to use Rstudio in order to see.
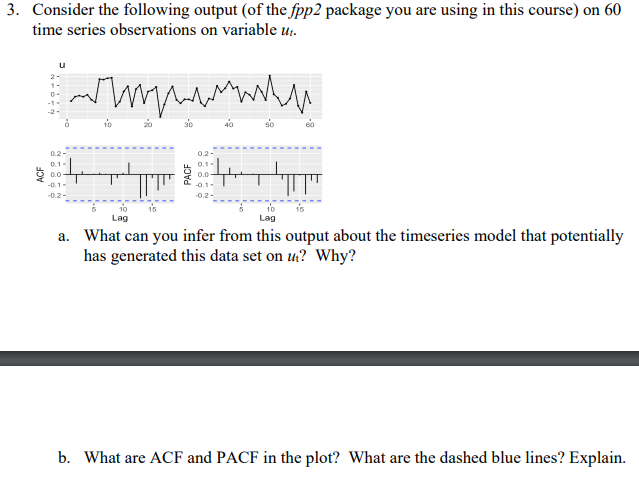
Consider the following output of the package you are using in this course on time series observations on variable has generated this data set on Why?
b What are ACF and PACF in the plot? What are the dashed blue lines? Explain.
Step by Step Solution
There are 3 Steps involved in it
1 Expert Approved Answer
Step: 1 Unlock

Question Has Been Solved by an Expert!
Get step-by-step solutions from verified subject matter experts
Step: 2 Unlock
Step: 3 Unlock