

Question: You will need to use MAD,MSE and MAPE Using the forecasts and forecast errors in the table below, construct a time plot for this time
You will need to use MAD,MSE and MAPE
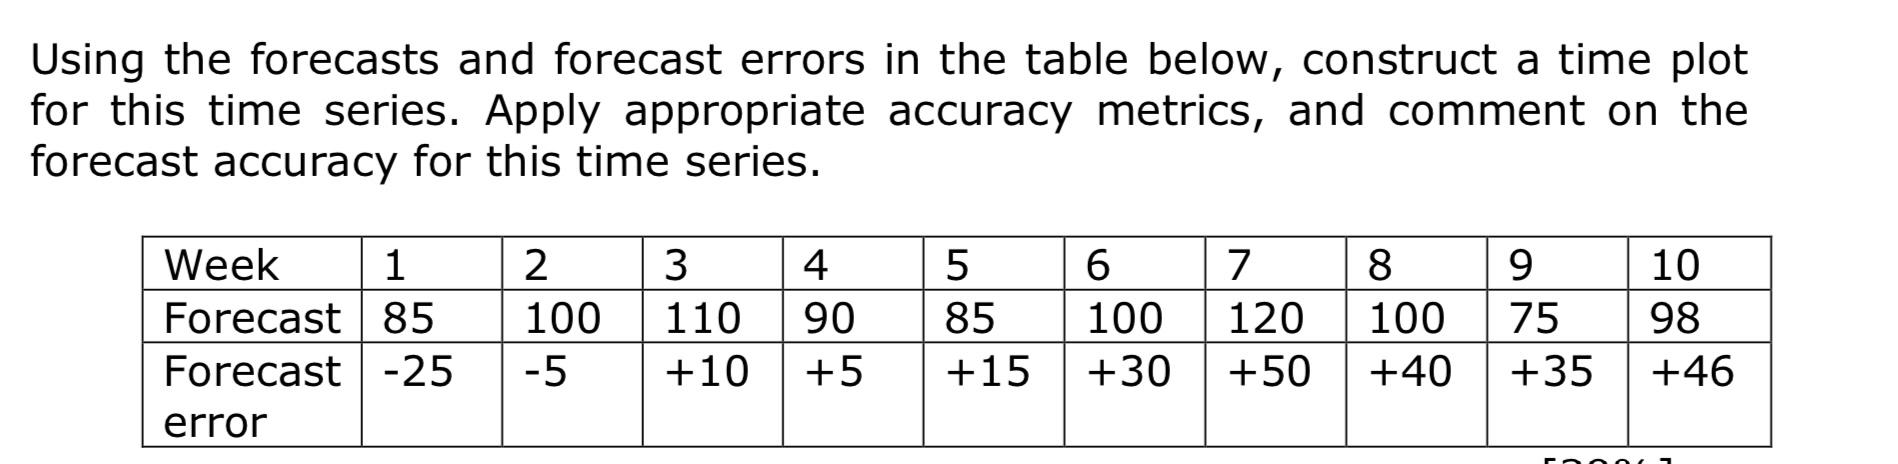
Using the forecasts and forecast errors in the table below, construct a time plot for this time series. Apply appropriate accuracy metrics, and comment on the forecast accuracy for this time series. 3 5 8 9 Week 1 Forecast 85 Forecast -25 2 100 4. 90 7 120 6 100 +30 10 98 110 100 85 +15 75 -5 +10 +5 +50 +40 +35 +46 errorStep by Step Solution
There are 3 Steps involved in it
1 Expert Approved Answer
Step: 1 Unlock

Question Has Been Solved by an Expert!
Get step-by-step solutions from verified subject matter experts
Step: 2 Unlock
Step: 3 Unlock