

Question: You will present your trading strategy. Specifically, you are expected to include following points: 1. Motivation: the economic intuition why you chose that indicator to
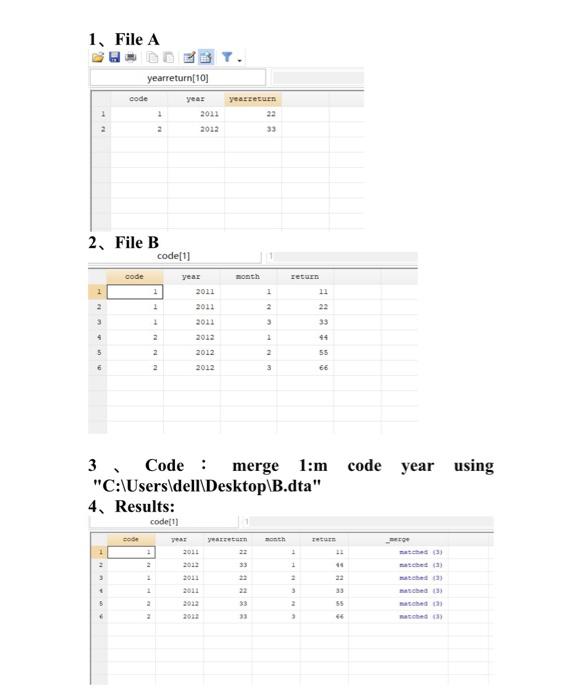
You will present your trading strategy. Specifically, you are expected to include following points: 1. Motivation: the economic intuition why you chose that indicator to construct a trading strategy 2. Show the main steps of how you construct your trading strategy, including data selection, sample period, the main sorting variable, the sorting process and models you are going to use to calculate abnormal returns (such as Fama and French 3 factor or 5 factor models). 3. Report the average monthly raw returns of each portfolio (might be terciles, quintiles or other portfolios depending on your setting) and the H-L portfolio (or might be L-H). 4. Report the average monthly abnormal returns of each portfolio and H-L portfolio with t-statistics. 5. Further analysis will be appreciated but not mandatory, On your presentation day, please also send me your printed report. Your report needs to incorporate the contents you present, and your also need to show the following parts: 1. The main programming for your analysis. 2. The detailed contribution of each group member, especially, who is responsible for the programming, and weighted contribution of each member to indicate whether you think your group members are equally contributed to the project. 1. File A BY. yearreturn[10] code year year EU 2 2012 22 2012 33 2. File B code(1) code month return 11 1 1 + + 2 year 2011 2011 2011 2012 2012 2012 3 2 1 44 2 2 55 2 3 66 code year using 3 Code : merge 1:m "C:\Users\dell\Desktop\B.dta" 4. Results: code(1) sh Det yearen 22 33 + 1 46 22 3 2 3 1 2 2 2011 2011 2012 3 55 33 3 watched matched You will present your trading strategy. Specifically, you are expected to include following points: 1. Motivation: the economic intuition why you chose that indicator to construct a trading strategy 2. Show the main steps of how you construct your trading strategy, including data selection, sample period, the main sorting variable, the sorting process and models you are going to use to calculate abnormal returns (such as Fama and French 3 factor or 5 factor models). 3. Report the average monthly raw returns of each portfolio (might be terciles, quintiles or other portfolios depending on your setting) and the H-L portfolio (or might be L-H). 4. Report the average monthly abnormal returns of each portfolio and H-L portfolio with t-statistics. 5. Further analysis will be appreciated but not mandatory, On your presentation day, please also send me your printed report. Your report needs to incorporate the contents you present, and your also need to show the following parts: 1. The main programming for your analysis. 2. The detailed contribution of each group member, especially, who is responsible for the programming, and weighted contribution of each member to indicate whether you think your group members are equally contributed to the project. 1. File A BY. yearreturn[10] code year year EU 2 2012 22 2012 33 2. File B code(1) code month return 11 1 1 + + 2 year 2011 2011 2011 2012 2012 2012 3 2 1 44 2 2 55 2 3 66 code year using 3 Code : merge 1:m "C:\Users\dell\Desktop\B.dta" 4. Results: code(1) sh Det yearen 22 33 + 1 46 22 3 2 3 1 2 2 2011 2011 2012 3 55 33 3 watched matched
Step by Step Solution
There are 3 Steps involved in it

Get step-by-step solutions from verified subject matter experts