

Question: You will probably want to use Excel, R, Python, or Matlab to do this exercise. Consider the following three assets: --(E)-(0)--(414) = == 2
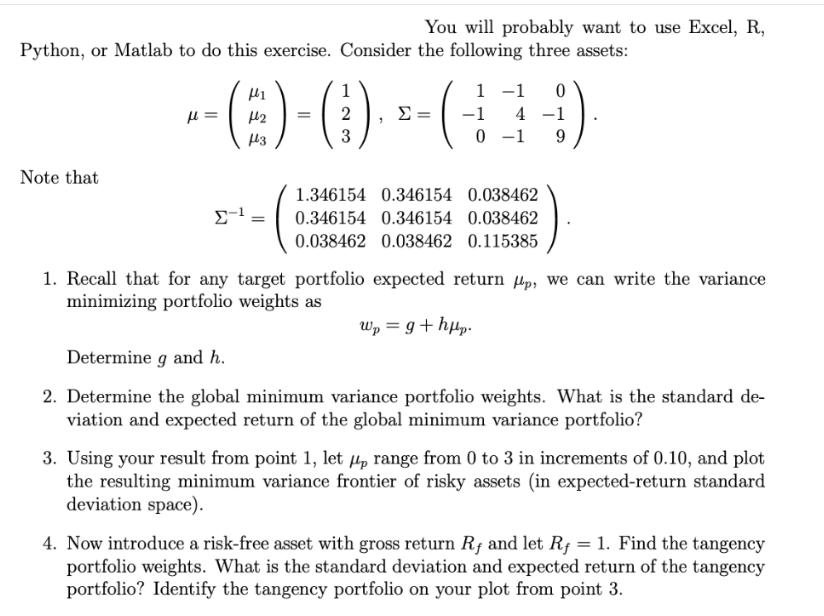
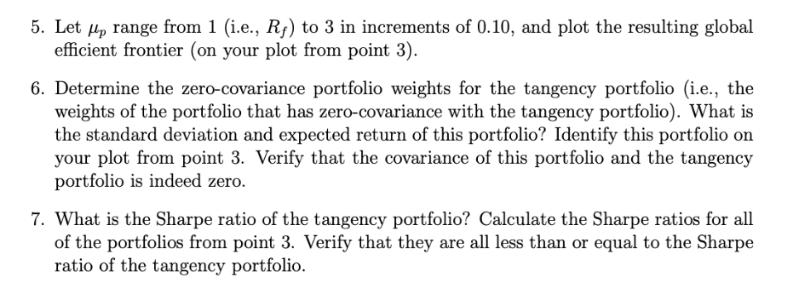
You will probably want to use Excel, R, Python, or Matlab to do this exercise. Consider the following three assets: --(E)-(0)--(414) = == 2 3 = 9 Note that = 1.346154 0.346154 0.038462 0.346154 0.346154 0.038462 0.038462 0.038462 0.115385 1. Recall that for any target portfolio expected return p, we can write the variance minimizing portfolio weights as Determine g and h. Wp = g+hpp. 2. Determine the global minimum variance portfolio weights. What is the standard de- viation and expected return of the global minimum variance portfolio? 3. Using your result from point 1, let p range from 0 to 3 in increments of 0.10, and plot the resulting minimum variance frontier of risky assets (in expected-return standard deviation space). 4. Now introduce a risk-free asset with gross return Rf and let Rf = 1. Find the tangency portfolio weights. What is the standard deviation and expected return of the tangency portfolio? Identify the tangency portfolio on your plot from point 3. 5. Let up range from 1 (i.e., R) to 3 in increments of 0.10, and plot the resulting global efficient frontier (on your plot from point 3). 6. Determine the zero-covariance portfolio weights for the tangency portfolio (i.e., the weights of the portfolio that has zero-covariance with the tangency portfolio). What is the standard deviation and expected return of this portfolio? Identify this portfolio on your plot from point 3. Verify that the covariance of this portfolio and the tangency portfolio is indeed zero. 7. What is the Sharpe ratio of the tangency portfolio? Calculate the Sharpe ratios for all of the portfolios from point 3. Verify that they are all less than or equal to the Sharpe ratio of the tangency portfolio.
Step by Step Solution
There are 3 Steps involved in it

Get step-by-step solutions from verified subject matter experts