

Question: You will use Excel to simulate rolling five 6-sided dice and calculating the average and standard deviation of the five numbers. You will also

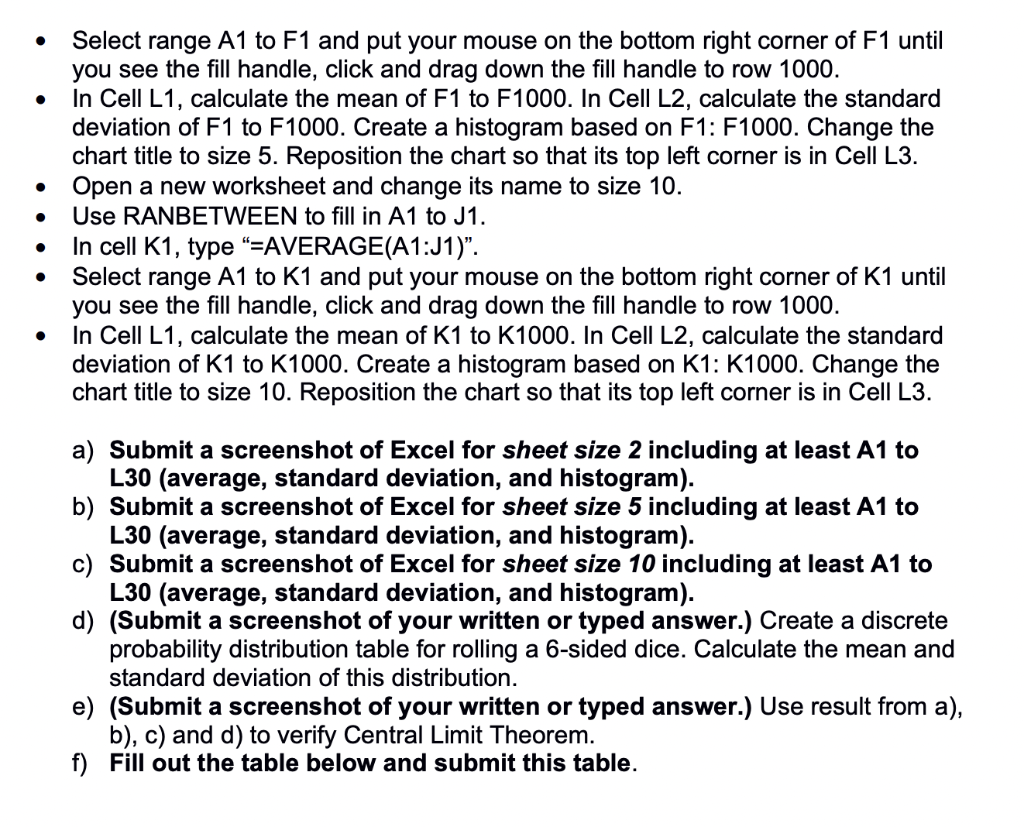
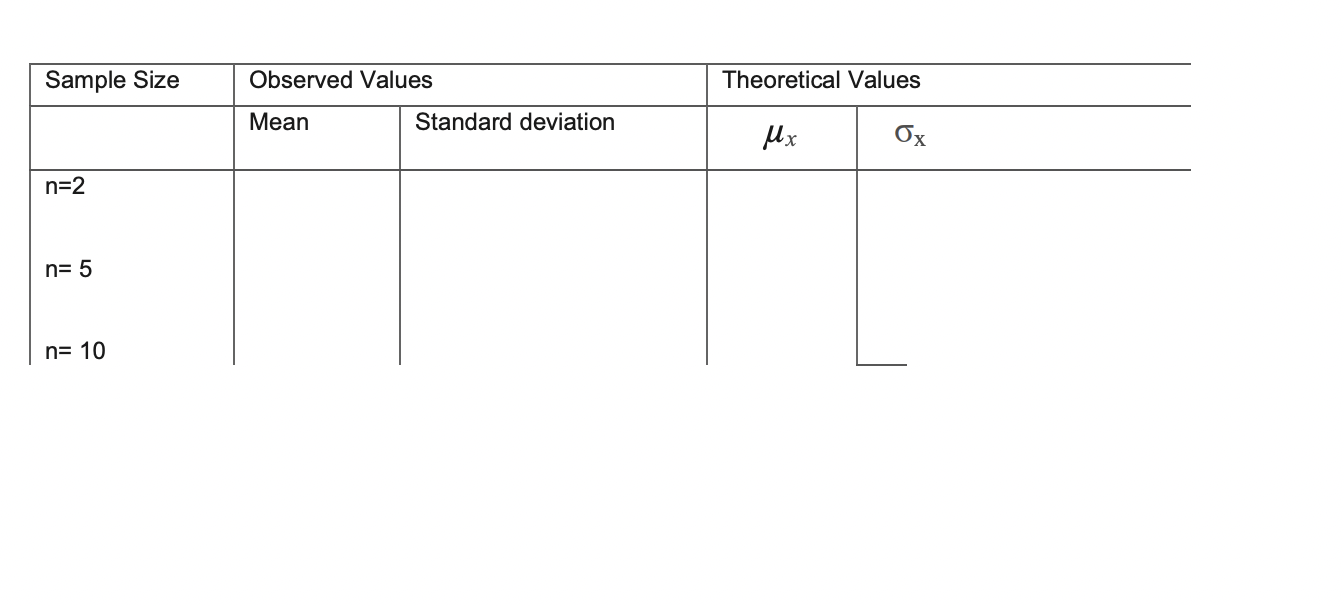
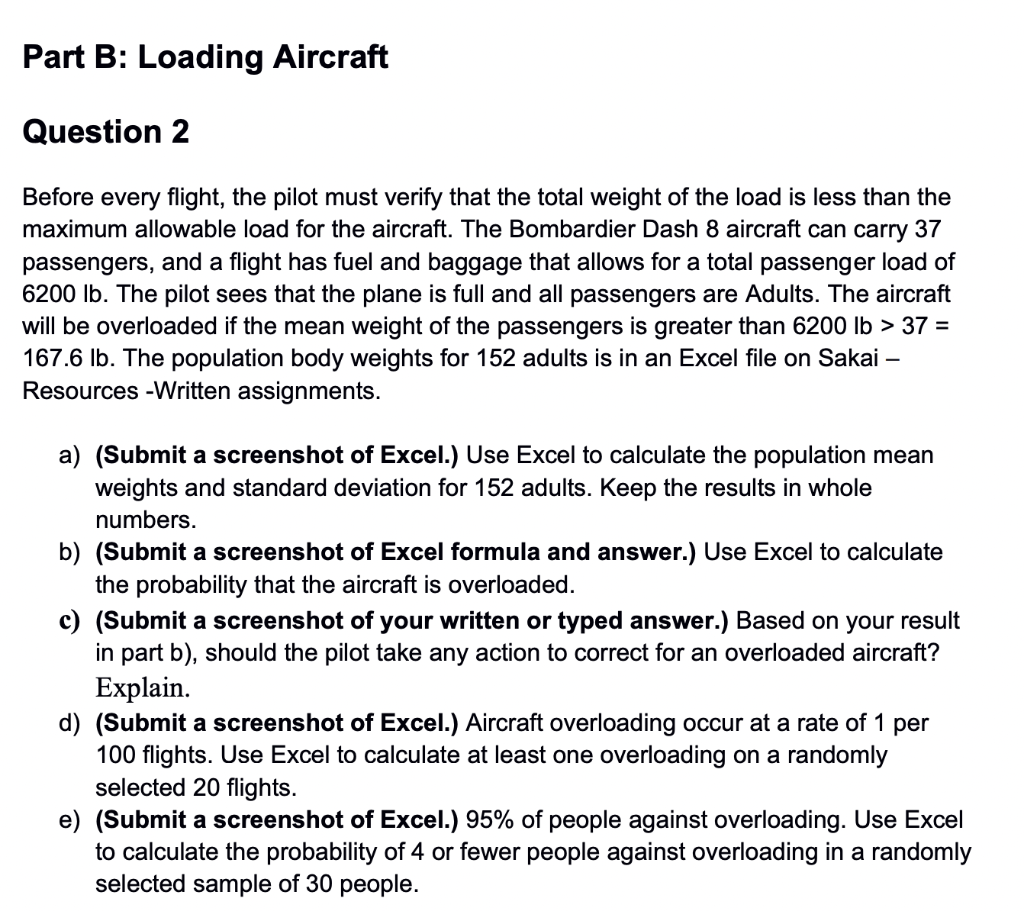
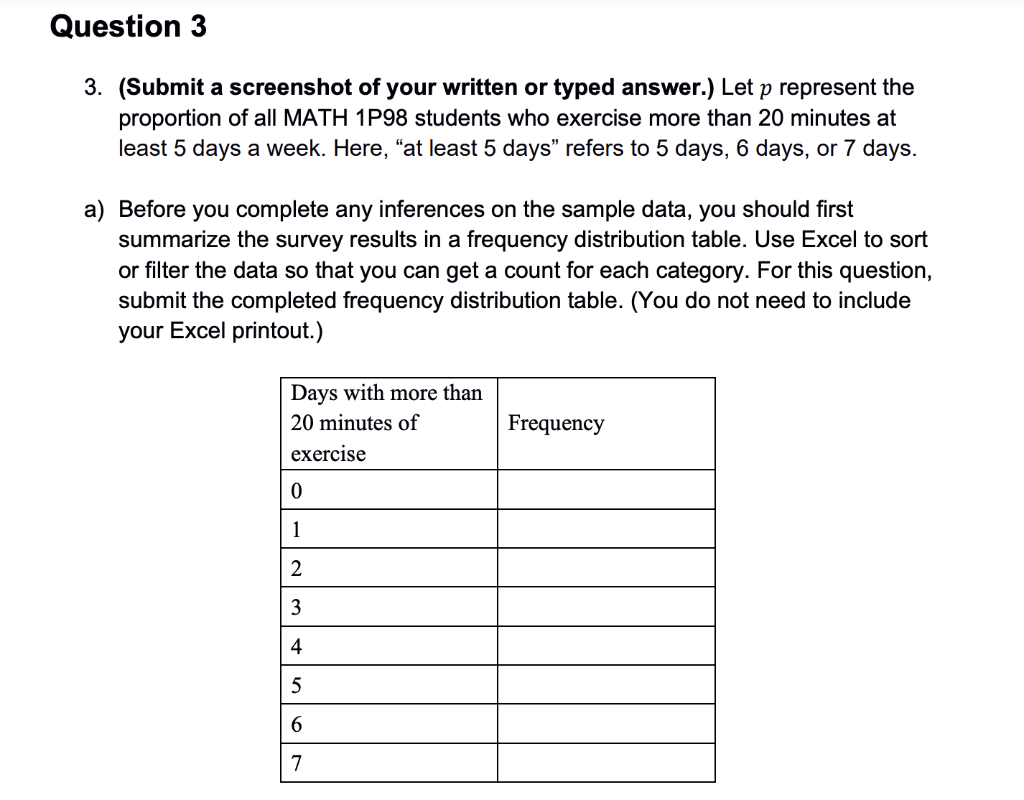
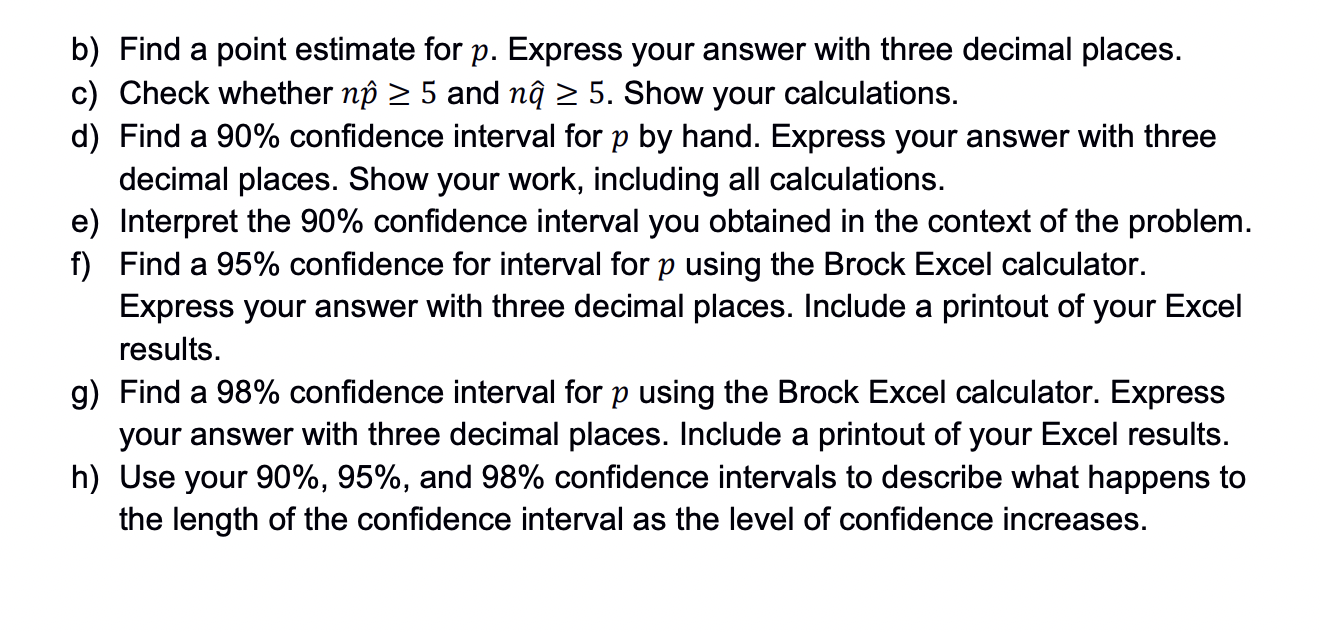
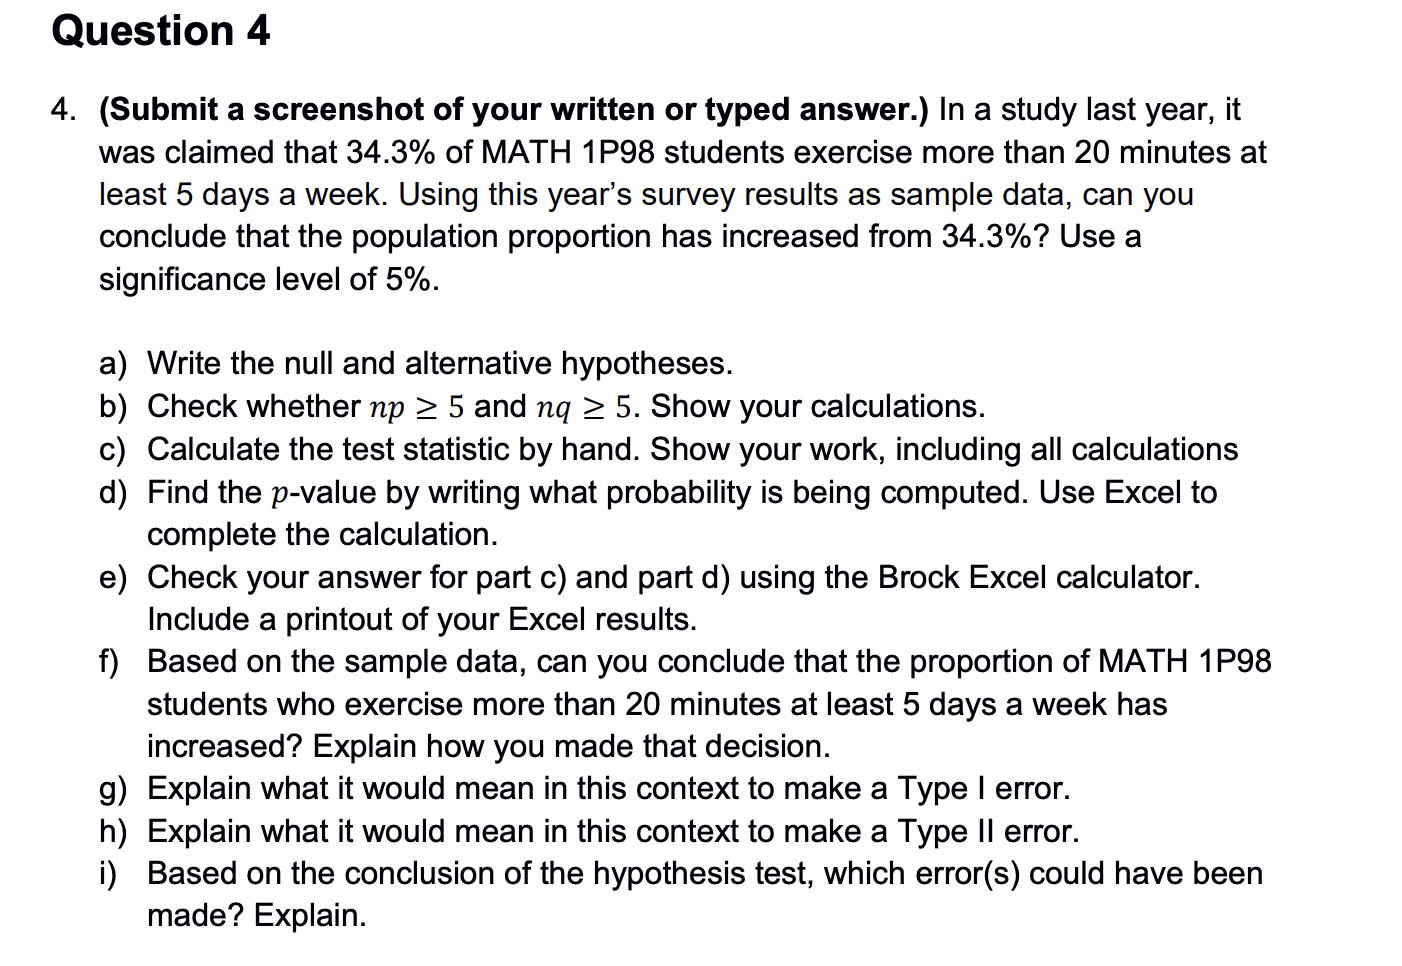
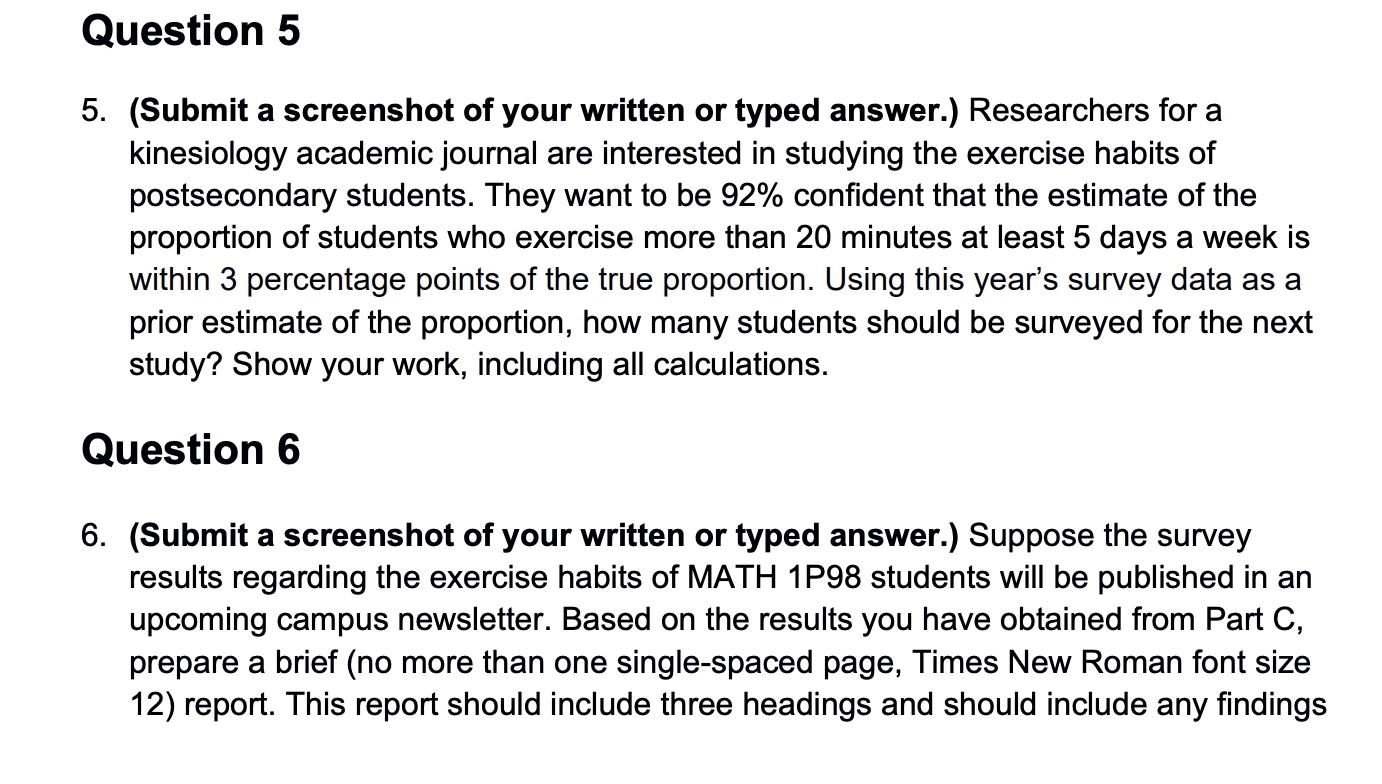
You will use Excel to simulate rolling five 6-sided dice and calculating the average and standard deviation of the five numbers. You will also calculate the mean and standard deviation when rolling one dice. You will demonstrate the effect of the sample size on the shape, mean, and standard deviation of the sampling distribution of the mean. Finally, you will verify Central Limit Theorem. Open a new Excel document. Double click sheet 1 and change the sheet name to size 2. Click on cell A1, then click on the function icon fx and select Math&Trig, then select RANDBETWEEN. In the dialog box, enter 1 for bottom and enter 6 for top. Use the fill handle (solid cross sign on the bottom right corner of A1) to copy the formula in A1 into B1. In cell C1, type "=AVERAGE(A1:B1)". Select range A1 to C1 and put your mouse on the bottom right corner of C1 until you see the fill handle, click and drag down the fill handle to row 1000. In Cell L1, calculate the mean of C1 to C1000. In Cell L2, calculate the standard deviation of C1 to C1000. Create a histogram based on C1: C1000. Change the chart title to size 2. Reposition the chart so that its top left corner is in Cell L3. Open a new worksheet and change its name to size 5. Use RANBETWEEN to fill in A1 to E1. . In cell F1, type "=AVERAGE(A1:E1)". Select range A1 to F1 and put your mouse on the bottom right corner of F1 until you see the fill handle, click and drag down the fill handle to row 1000. In Cell L1, calculate the mean of F1 to F1000. In Cell L2, calculate the standard deviation of F1 to F1000. Create a histogram based on F1: F1000. Change the chart title to size 5. Reposition the chart so that its top left corner is in Cell L3. Open a new worksheet and change its name to size 10. Use RANBETWEEN to fill in A1 to J1. In cell K1, type "=AVERAGE(A1:J1)". Select range A1 to K1 and put your mouse on the bottom right corner of K1 until you see the fill handle, click and drag down the fill handle to row 1000. In Cell L1, calculate the mean of K1 to K1000. In Cell L2, calculate the standard deviation of K1 to K1000. Create a histogram based on K1: K1000. Change the chart title to size 10. Reposition the chart so that its top left corner is in Cell L3. a) Submit a screenshot of Excel for sheet size 2 including at least A1 to L30 (average, standard deviation, and histogram). b) Submit a screenshot of Excel for sheet size 5 including at least A1 to L30 (average, standard deviation, and histogram). c) Submit a screenshot of Excel for sheet size 10 including at least A1 to L30 (average, standard deviation, and histogram). d) (Submit a screenshot of your written or typed answer.) Create a discrete probability distribution table for rolling a 6-sided dice. Calculate the mean and standard deviation of this distribution. e) (Submit a screenshot of your written or typed answer.) Use result from a), b), c) and d) to verify Central Limit Theorem. f) Fill out the table below and submit this table. Sample Size n=2 n=5 n= 10 Observed Values Mean Theoretical Values Standard deviation Ox Part B: Loading Aircraft Question 2 Before every flight, the pilot must verify that the total weight of the load is less than the maximum allowable load for the aircraft. The Bombardier Dash 8 aircraft can carry 37 passengers, and a flight has fuel and baggage that allows for a total passenger load of 6200 lb. The pilot sees that the plane is full and all passengers are Adults. The aircraft will be overloaded if the mean weight of the passengers is greater than 6200 lb > 37 = 167.6 lb. The population body weights for 152 adults is in an Excel file on Sakai - Resources -Written assignments. a) (Submit a screenshot of Excel.) Use Excel to calculate the population mean weights and standard deviation for 152 adults. Keep the results in whole numbers. b) (Submit a screenshot of Excel formula and answer.) Use Excel to calculate the probability that the aircraft is overloaded. c) (Submit a screenshot of your written or typed answer.) Based on your result in part b), should the pilot take any action to correct for an overloaded aircraft? Explain. d) (Submit a screenshot of Excel.) Aircraft overloading occur at a rate of 1 per 100 flights. Use Excel to calculate at least one overloading on a randomly selected 20 flights. e) (Submit a screenshot of Excel.) 95% of people against overloading. Use Excel to calculate the probability of 4 or fewer people against overloading in a randomly selected sample of 30 people. Part C: Math 1P98 Survey Data Your classmates were invited to complete a MATH 1P98 student survey. In this last part of the assignment, you will work with the results from that survey. Students were asked, "How many days in a typical week do you exercise for more than 20 minutes?. See the Excel sheet "Assignment 2 - Survey" given in in the "Written Assignment 2" folder on Sakai for the responses. You will use the Brock Excel calculator Hypothesis Test and Confidence Interval Template" found in the same folder. Question 3 3. (Submit a screenshot of your written or typed answer.) Let p represent the proportion of all MATH 1P98 students who exercise more than 20 minutes at least 5 days a week. Here, "at least 5 days" refers to 5 days, 6 days, or 7 days. a) Before you complete any inferences on the sample data, you should first summarize the survey results in a frequency distribution table. Use Excel to sort or filter the data so that you can get a count for each category. For this question, submit the completed frequency distribution table. (You do not need to include your Excel printout.) Days with more than 20 minutes of exercise 0 1 2 3 4 5 6 7 Frequency b) Find a point estimate for p. Express your answer with three decimal places. c) Check whether n 5 and n 5. Show your calculations. d) Find a 90% confidence interval for p by hand. Express your answer with three decimal places. Show your work, including all calculations. e) Interpret the 90% confidence interval you obtained in the context of the problem. f) Find a 95% confidence for interval for p using the Brock Excel calculator. Express your answer with three decimal places. Include a printout of your Excel results. g) Find a 98% confidence interval for p using the Brock Excel calculator. Express your answer with three decimal places. Include a printout of your Excel results. h) Use your 90%, 95%, and 98% confidence intervals to describe what happens to the length of the confidence interval as the level of confidence increases. Question 4 4. (Submit a screenshot of your written or typed answer.) In a study last year, it was claimed that 34.3% of MATH 1P98 students exercise more than 20 minutes at least 5 days a week. Using this year's survey results as sample data, can you conclude that the population proportion has increased from 34.3%? Use a significance level of 5%. a) Write the null and alternative hypotheses. b) Check whether np 5 and nq 5. Show your calculations. c) Calculate the test statistic by hand. Show your work, including all calculations d) Find the p-value by writing what probability is being computed. Use Excel to complete the calculation. e) Check your answer for part c) and part d) using the Brock Excel calculator. Include a printout of your Excel results. f) Based on the sample data, can you conclude that the proportion of MATH 1P98 students who exercise more than 20 minutes at least 5 days a week has increased? Explain how you made that decision. g) Explain what it would mean in this context to make a Type I error. h) Explain what it would mean in this context to make a Type II error. i) Based on the conclusion of the hypothesis test, which error(s) could have been made? Explain. Question 5 5. (Submit a screenshot of your written or typed answer.) Researchers for a kinesiology academic journal are interested in studying the exercise habits of postsecondary students. They want to be 92% confident that the estimate of the proportion of students who exercise more than 20 minutes at least 5 days a week is within 3 percentage points of the true proportion. Using this year's survey data as a prior estimate of the proportion, how many students should be surveyed for the next study? Show your work, including all calculations. Question 6 6. (Submit a screenshot of your written or typed answer.) Suppose the survey results regarding the exercise habits of MATH 1P98 students will be published in an upcoming campus newsletter. Based on the results you have obtained from Part C, prepare a brief (no more than one single-spaced page, Times New Roman font size 12) report. This report should include three headings and should include any findings you think are noteworthy: Introduction (statement of problem, sample size, survey details, context, etc.), Results (report, summarize, and interpret the results of the confidence interval and hypothesis test), and Conclusions/Recommendations (inference on the population, sample size for future study, recommendations to improve future study, etc.).
Step by Step Solution
3.48 Rating (151 Votes )
There are 3 Steps involved in it
a Discrete Probability Distribution Table for Rolling a 6sided Dice The discrete probability distribution table for rolling a 6sided dice would have values from 1 to 6 each with a probability of 16 si... View full answer

Get step-by-step solutions from verified subject matter experts