

Question: You will work with a restaurant dataset containing the customer ID, the time when the customer came (either for lunch or for dinner) and the
You will work with a restaurant dataset containing the customer ID, the time when the customer came (either for lunch or for dinner) and the cost of the first, second and third course. Every course consists of a meal and some drinks. In this case the food has a fixed cost (see the menu below) while the drinks are a random number that is added (let's just say the restaurant has a very wide range of drinks).
The restaurant has different types of clients. The business clients are more likely to have the more expensive dishes. The restaurant is located next to a fitness center and attracts some of those healthier folks ; they usually go for soups or salads and hardly ever take desserts. Across the street there is a retirement center ; their residents usually take a three-course menu, often ending with a nice piece of pie. The other customers are one-time customers who are passing by for a quick main dish.
The end goal is to look in the data for signs of these customers. Can we find which ones are likely which type? Once we have this we can determine their likelihood of visiting, what dishes they usually order, etc. The restaurant asked us to use this data to create some simulations using this data :
- Starters: Soup $3, Tomato-Mozarella $15, Oysters $20
- Mains: Salad $9, Spaghetti $20, Steak $25, Lobster $40
- Desserts: Ice cream $15, Pie $10
Header
Q 1 : Data Collection
What are the best line of code to import the data is. Read in the data in csv files, understand the data structure, verify quality of data. For this exploratory work, listing values of categorical data and plotting numerical data can help.
Q2 : Data Preparation
Create the columns of data, extract the "features", needed for your later modeling. For each course, create 2 columns with the split costs of food and drinks, i.e. you will be creating a total of 6 columns. You will determine the split costs by assuming that the cost of every course is the cost of a single dish plus cost of drinks, and that the cost of drinks is never greater or equal to $5 (the smaller difference b/w 2 dishes). For example, if the cost of the first course is $5.5, the customer took a $3 soup and drinks for $2.5; if the cost was $20, he took the oysters and no drinks.
Q3 : Modeling
Cluster using Kmeans the data against the cost of food only. You can assume there are 4 clusters. Don't use time or any other information, just cluster on the 3 columns for food cost. Print out specific characteristics per group. Can you figure out which is the healthy group, the retirement group, business and one-time customers? Add these labels to your data. Display the data in a scatter plot.
Q4 : Evaluation
In part3.csv you can find the ID and the actual type. Compare the labels to the actual client type.
Q5 : Simulation
- Plot the distribution of clients.
- Determine the likelihood for each type of client to order a certain course.
- Determine the probability of a certain type of customer ordering a certain dish.
- What's the percentage of clients not ordering a drink with each of his course?
- How would the revenue change if you can influence every other Healthy customer to spend/behave like a Onetime customer instead?
-By how much does revenue go up if the spaghetti dish increases by 10%?
Add one "research question" yourself like this and answer it.
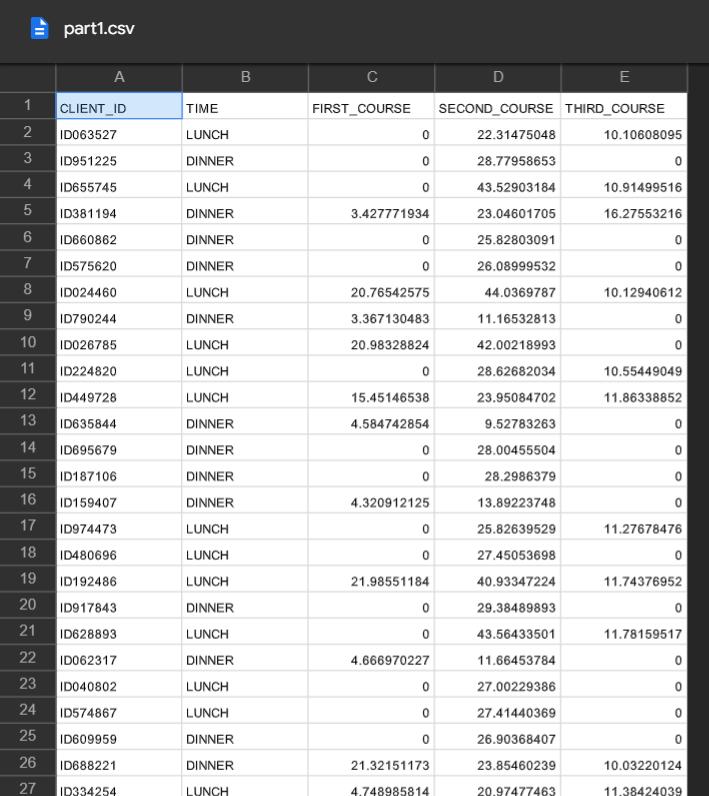
TABLE part1.csv Columns:
CLIENT_ID TIME FIRST_COURSE SECOND_COURSE THIRD_COURSE
ID063527 LUNCH 0 22.31475048 10.10608095
ID951225 DINNER 0 28.77958653 0
ID655745 LUNCH 0 43.52903184 10.91499516
ID381194 DINNER 3.427771934 23.04601705 16.27553216
TABLE part3.csv Columns
CLIENT_ID CLIENT_TYPE
ID063527 Business
ID951225 Onetime
ID655745 Business
ID381194 Retirement
ID660862 Onetime
ID575620 Onetime
ID024460 Business
ID790244 Healthy

part1.csv A 1 CLIENT_ID 2 ID063527 3 ID951225 4 ID655745 5 ID381194 6 ID660862 7 ID575620 8 ID024460 9 ID790244 10 ID026785 11 ID224820 12 ID449728 13 ID635844 14 ID695679 15 ID187106 16 ID159407 17 ID974473 18 ID480696 19 ID192486 20 ID917843 21 ID628893 22 ID062317 23 ID040802 24 ID574867 ID609959 25 26 ID688221 27 ID334254 TIME LUNCH DINNER LUNCH DINNER DINNER DINNER LUNCH DINNER LUNCH LUNCH LUNCH DINNER DINNER DINNER DINNER LUNCH LUNCH LUNCH DINNER LUNCH DINNER LUNCH LUNCH DINNER DINNER LUNCH B FIRST COURSE 0 0 0 3.427771934 0 0 20.76542575 3.367130483 20.98328824 0 15.45146538 4.584742854 0 0 4.320912125 0 0 21.98551184 0 0 4.666970227 0 0 0 21.32151173 4.748985814 D SECOND_COURSE THIRD COURSE 10.10608095 E LU 22.31475048 28.77958653 43.52903184 23.04601705 25.82803091 26.08999532 44.0369787 11.16532813 42.00218993 28.62682034 23.95084702 9.52783263 28.00455504 28.2986379 13.89223748 25.82639529 27.45053698 40.93347224 29.38489893 43.56433501 11.66453784 27.00229386 27.41440369 26.90368407 23.85460239 20.97477463 0 10.91499516 16.27553216 0 0 10.12940612 0 0 10.55449049 11.86338852 0 0 0 11.27678476 0 11.74376952 0 11.78159517 0 0 0 10.03220124 11.38424039
Step by Step Solution
3.39 Rating (152 Votes )
There are 3 Steps involved in it
Q1 Data Collection To import and explore the restaurant dataset from a CSV file you can use Python and libraries like pandas for data manipulation and matplotlibseaborn for data visualization Heres a ... View full answer

Get step-by-step solutions from verified subject matter experts