

Question: Your help is highly appreciated. Create a stacked bar graph showing the distribution of pilots' level of competence in basic attitude flying when grouped according
Your help is highly appreciated.
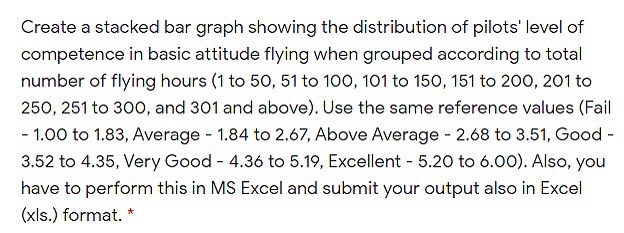
Create a stacked bar graph showing the distribution of pilots' level of competence in basic attitude flying when grouped according to total number of flying hours (1 to 50, 51 to 100, 101 to 150, 151 to 200, 201 to 250, 251 to 300, and 301 and above). Use the same reference values (Fail - 1.00 to 1.83, Average - 1.84 to 2.67, Above Average - 2.68 to 3.51, Good - 3.52 to 4.35, Very Good - 4.36 to 5.19, Excellent - 5.20 to 6.00). Also, you have to perform this in MS Excel and submit your output also in Excel (xls.) format. *
Step by Step Solution
There are 3 Steps involved in it
1 Expert Approved Answer
Step: 1 Unlock

Question Has Been Solved by an Expert!
Get step-by-step solutions from verified subject matter experts
Step: 2 Unlock
Step: 3 Unlock