

Question: Your task for this project is to build a graph representing a network that spans cross Canada: Each major Canadian city (Vancouver, Edmonton, Calgary,
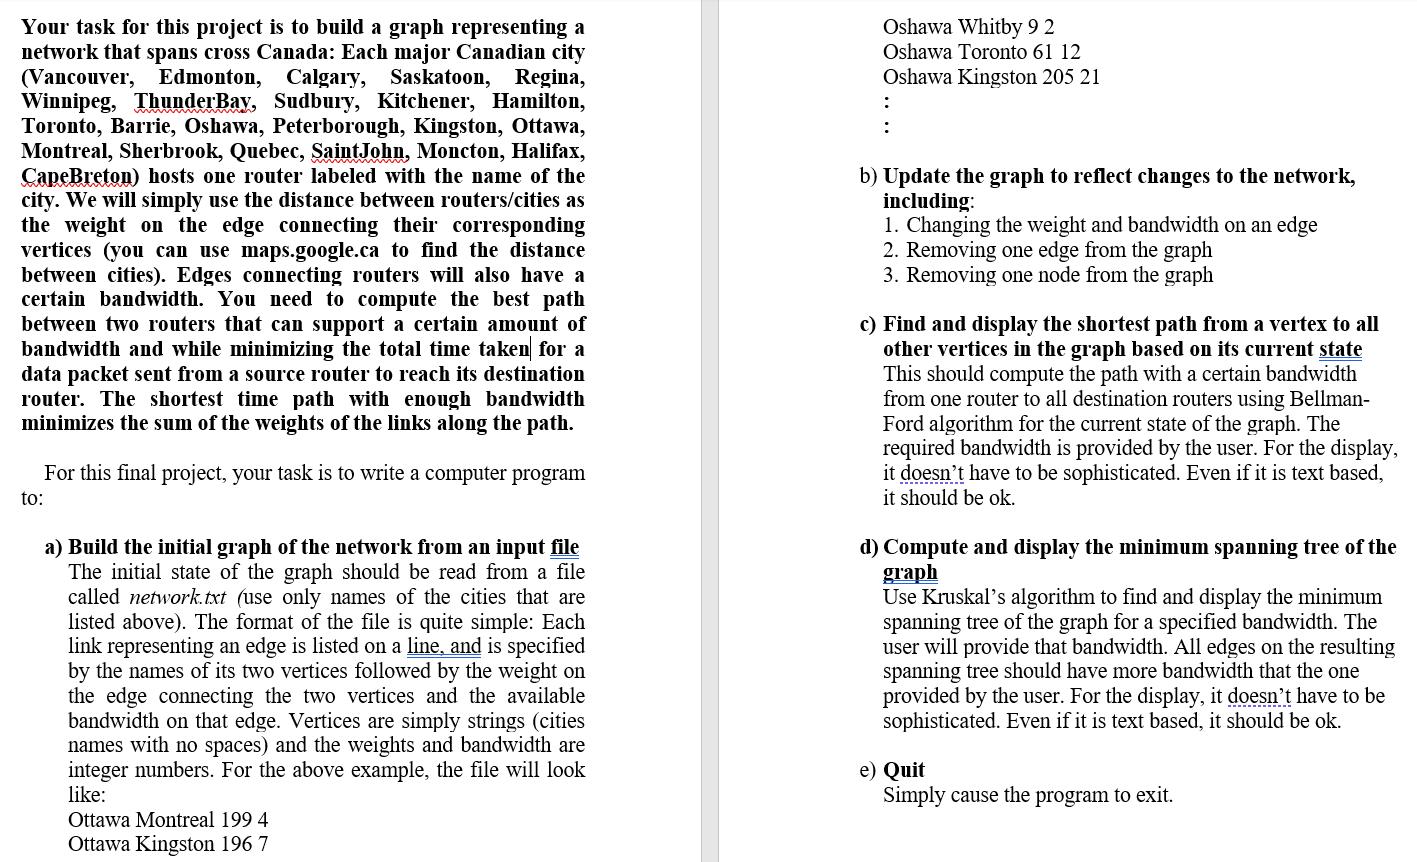
Your task for this project is to build a graph representing a network that spans cross Canada: Each major Canadian city (Vancouver, Edmonton, Calgary, Saskatoon, Regina, Winnipeg, ThunderBay, Sudbury, Kitchener, Hamilton, Toronto, Barrie, Oshawa, Peterborough, Kingston, Ottawa, Montreal, Sherbrook, Quebec, SaintJohn, Moncton, Halifax, CapeBreton) hosts one router labeled with the name of the city. We will simply use the distance between routers/cities as the weight on the edge connecting their corresponding vertices (you can use maps.google.ca to find the distance between cities). Edges connecting routers will also have a certain bandwidth. You need to compute the best path between two routers that can support a certain amount of bandwidth and while minimizing the total time taken for a data packet sent from a source router to reach its destination router. The shortest time path with enough bandwidth minimizes the sum of the weights of the links along the path. Oshawa Whitby 9 2 Oshawa Toronto 61 12 Oshawa Kingston 205 21 b) Update the graph to reflect changes to the network, including: 1. Changing the weight and bandwidth on an edge 2. Removing one edge from the graph 3. Removing one node from the graph c) Find and display the shortest path from a vertex to all other vertices in the graph based on its current state This should compute the path with a certain bandwidth from one router to all destination routers using Bellman- Ford algorithm for the current state of the graph. The required bandwidth is provided by the user. For the display, it doesn't have to be sophisticated. Even if it is text based, it should be ok. For this final project, your task is to write a computer program to: a) Build the initial graph of the network from an input file The initial state of the graph should be read from a file called network.txt (use only names of the cities that are listed above). The format of the file is quite simple: Each link representing an edge is listed on a line, and is specified by the names of its two vertices followed by the weight on the edge connecting the two vertices and the available bandwidth on that edge. Vertices are simply strings (cities names with no spaces) and the weights and bandwidth are integer numbers. For the above example, the file will look like: d) Compute and display the minimum spanning tree of the graph Use Kruskal's algorithm to find and display the minimum spanning tree of the graph for a specified bandwidth. The user will provide that bandwidth. All edges on the resulting spanning tree should have more bandwidth that the one provided by the user. For the display, it doesn't have to be sophisticated. Even if it is text based, it should be ok. e) Quit Simply cause the program to exit. Ottawa Montreal 199 4 Ottawa Kingston 196 7
Step by Step Solution
3.55 Rating (159 Votes )
There are 3 Steps involved in it
Sol a import networkx as nx import csv Data opentestestcsv r encodingutf8 read csvreaderData GraphtypenxGraph use netGraph for undirected graph G nxre... View full answer

Get step-by-step solutions from verified subject matter experts