

Question: Your task is to create an index, using Excel, from the 30 stocks in the table found in the attached excel spreadsheet. Using the information
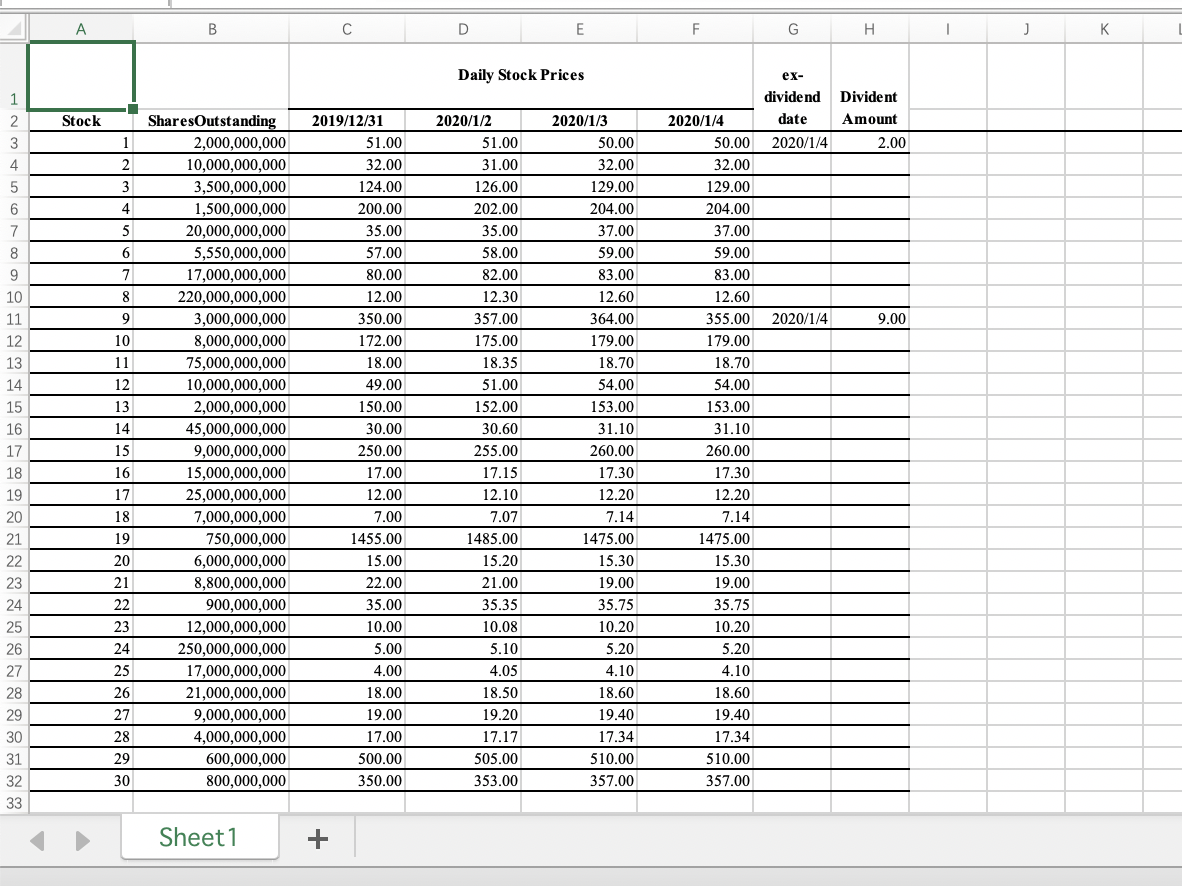
Your task is to create an index, using Excel, from the 30 stocks in the table found in the attached excel spreadsheet. Using the information presented in the following table, answer the following set of questions: a. [6] Compute the return on the value-weighted (also called market capitalization weighted) index for each of Day 1, Day 2, and Day 3? b. [6] Compute the return on the price-weighted index for each of Day 1, 2, and 3. c. [5] Compute the average returns to: i. The 15 largest (market cap) and 15 smallest (market cap) stocks among the 30 for each Day 1 and 2. ii. The 15 highest price and 15 smallest price stocks among the 30 for each Day 1 and Day 2. iii. Are the averages in i. and ii. consistent with your answers to a. and b.? d. [1] Consider the market capitalization-weighted index. i. Around the dividend distributions on Jan 4, how would the index multiplier be used to counteract the effect of the dividend? e. [4] Consider stock #19 splitting 2-for-1 at the end of trading on Jan 4. The shares outstanding double and the price cuts in half. i. How would the index multiplier be used to smooth out the effect in the cap weighted index? ii. How would the index multiplier be used to smooth out the effect in the price weighted? iii. What will happen to the stock's weight in the cap weighted index as a result? iv. What will happen to the stock's weight in the price-weighted index as a result? f. [5] Compute the return to a version of this index that is equally weighted. At the end of Jan 4, 2010, assuming no rebalancing since Dec 31, what will be the new weights? If the index were to be rebalanced to restore equal weights at the end of Jan 4, indicate the necessary adjustments in terms of the percentage of the portfolio that must be traded to restore equal weights. g. [3] If the index were equal-weighted instead of value-weighted, would the Day 1 return be greater than, less than or equal to the value-weighted index return in part b? Provide intuition, in addition to a specific numerical return. Note: The dividend information is presented by ex-date, meaning the day on which the seller receives the dividend, not the buyer. A B C D E F G H Daily Stock Prices ex- dividend date 2020/1/4 Stock Divident Amount 2.00 2020/1/4 9.00 T SharesOutstanding 2,000,000,000 10,000,000,000 3,500,000,000 1,500,000,000 20,000,000,000 5,550,000,000 17,000,000,000 220,000,000,000 3,000,000,000 8,000,000,000 75,000,000,000 10,000,000,000 2,000,000,000 45,000,000,000 9,000,000,000 15,000,000,000 25,000,000,000 7.000.000.000 750,000,000 6,000,000,000 8,800,000,000 900,000,000 12,000,000,000 250,000,000,000 17,000,000,000 21,000,000,000 9,000,000,000 4,000,000,000 600,000,000 800,000,000 2019/12/31 51.00 32.00 124.00 200.00 35.00 57.00 80.00 12.00 350.00 172.00 18.00 49.00 150.00 30.00 250.00 17.00 12.00 7.00 1455.00 15.00 22.00 35.00 10.00 5.00 4.00 18.00 19.00 17.00 500.00 350.00 2 020/1/2 51.00 31.00 126.00 202.00 35.00 58.00 82.00 12.30 357.00 175.00 18.35 51.00 152.00 30.60 255.00 17.15 12.10 7.07 1485.00 2020/1/3 50.00 32.00 129.00 204.00 37.00 59.00 83.00 12.60 364.00 179.00 18.70 54.00 153.00 31.10 260.00 17.30 12.20 7.14 1475.00 15.30 19.00 35.75 10.20 5.20 4.10 18.60 19.40 17.34 510.00 357.00 2020/1/4 | 50.00 32.00 129.00 204.00 37.00 59.00 83.00 12.60 355.00 179.00 18.70 54.00 153.00 31.10 260.00 17.30 12.20 7.14 1475.00 15.30 19.00 35.75 10.20 5.20 15.20 4.10 21.00 35.35 10.08 5.10 4.05 18.50 19.20 17.17 505.00 353.00 18.60 19.40 17.34 510.00 357.00 Sheet1 + Your task is to create an index, using Excel, from the 30 stocks in the table found in the attached excel spreadsheet. Using the information presented in the following table, answer the following set of questions: a. [6] Compute the return on the value-weighted (also called market capitalization weighted) index for each of Day 1, Day 2, and Day 3? b. [6] Compute the return on the price-weighted index for each of Day 1, 2, and 3. c. [5] Compute the average returns to: i. The 15 largest (market cap) and 15 smallest (market cap) stocks among the 30 for each Day 1 and 2. ii. The 15 highest price and 15 smallest price stocks among the 30 for each Day 1 and Day 2. iii. Are the averages in i. and ii. consistent with your answers to a. and b.? d. [1] Consider the market capitalization-weighted index. i. Around the dividend distributions on Jan 4, how would the index multiplier be used to counteract the effect of the dividend? e. [4] Consider stock #19 splitting 2-for-1 at the end of trading on Jan 4. The shares outstanding double and the price cuts in half. i. How would the index multiplier be used to smooth out the effect in the cap weighted index? ii. How would the index multiplier be used to smooth out the effect in the price weighted? iii. What will happen to the stock's weight in the cap weighted index as a result? iv. What will happen to the stock's weight in the price-weighted index as a result? f. [5] Compute the return to a version of this index that is equally weighted. At the end of Jan 4, 2010, assuming no rebalancing since Dec 31, what will be the new weights? If the index were to be rebalanced to restore equal weights at the end of Jan 4, indicate the necessary adjustments in terms of the percentage of the portfolio that must be traded to restore equal weights. g. [3] If the index were equal-weighted instead of value-weighted, would the Day 1 return be greater than, less than or equal to the value-weighted index return in part b? Provide intuition, in addition to a specific numerical return. Note: The dividend information is presented by ex-date, meaning the day on which the seller receives the dividend, not the buyer. A B C D E F G H Daily Stock Prices ex- dividend date 2020/1/4 Stock Divident Amount 2.00 2020/1/4 9.00 T SharesOutstanding 2,000,000,000 10,000,000,000 3,500,000,000 1,500,000,000 20,000,000,000 5,550,000,000 17,000,000,000 220,000,000,000 3,000,000,000 8,000,000,000 75,000,000,000 10,000,000,000 2,000,000,000 45,000,000,000 9,000,000,000 15,000,000,000 25,000,000,000 7.000.000.000 750,000,000 6,000,000,000 8,800,000,000 900,000,000 12,000,000,000 250,000,000,000 17,000,000,000 21,000,000,000 9,000,000,000 4,000,000,000 600,000,000 800,000,000 2019/12/31 51.00 32.00 124.00 200.00 35.00 57.00 80.00 12.00 350.00 172.00 18.00 49.00 150.00 30.00 250.00 17.00 12.00 7.00 1455.00 15.00 22.00 35.00 10.00 5.00 4.00 18.00 19.00 17.00 500.00 350.00 2 020/1/2 51.00 31.00 126.00 202.00 35.00 58.00 82.00 12.30 357.00 175.00 18.35 51.00 152.00 30.60 255.00 17.15 12.10 7.07 1485.00 2020/1/3 50.00 32.00 129.00 204.00 37.00 59.00 83.00 12.60 364.00 179.00 18.70 54.00 153.00 31.10 260.00 17.30 12.20 7.14 1475.00 15.30 19.00 35.75 10.20 5.20 4.10 18.60 19.40 17.34 510.00 357.00 2020/1/4 | 50.00 32.00 129.00 204.00 37.00 59.00 83.00 12.60 355.00 179.00 18.70 54.00 153.00 31.10 260.00 17.30 12.20 7.14 1475.00 15.30 19.00 35.75 10.20 5.20 15.20 4.10 21.00 35.35 10.08 5.10 4.05 18.50 19.20 17.17 505.00 353.00 18.60 19.40 17.34 510.00 357.00 Sheet1 +
Step by Step Solution
There are 3 Steps involved in it

Get step-by-step solutions from verified subject matter experts