

Question: Your visualization is in the form of a column chart showing annual sales by salesperson. How can you ada an additional visualization to the chart
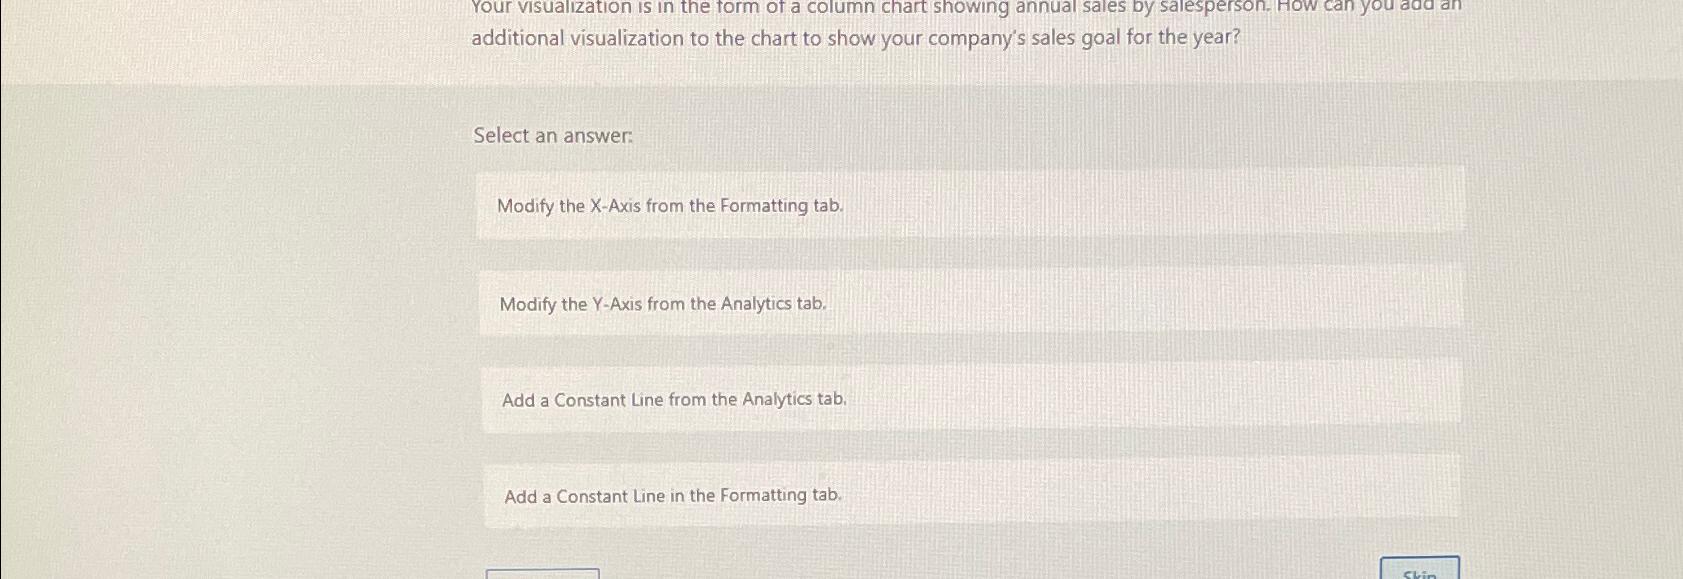
Your visualization is in the form of a column chart showing annual sales by salesperson. How can you ada an additional visualization to the chart to show your company's sales goal for the year?
Select an answer:
Modify the XAxis from the Formatting tab.
Modify the YAxis from the Analytics tab.
Add a Constant Line from the Analytics tab.
Add a Constant line in the Formatting tab.
Step by Step Solution
There are 3 Steps involved in it
1 Expert Approved Answer
Step: 1 Unlock

Question Has Been Solved by an Expert!
Get step-by-step solutions from verified subject matter experts
Step: 2 Unlock
Step: 3 Unlock