

Question: Yr Ended 12/31/12 PART I. Using horizontal analysis and 2012 as the base year, calculate Trend Percentages for each of the Income Statement items. You
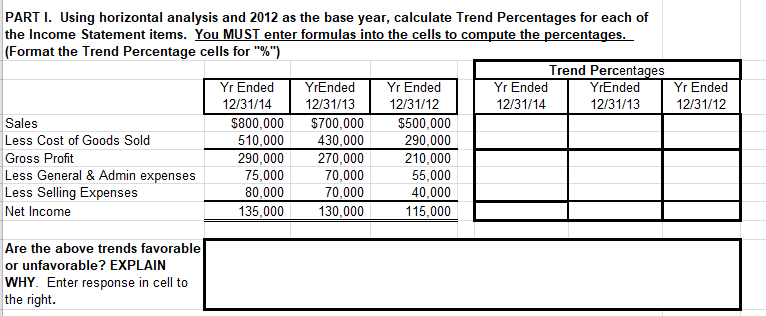
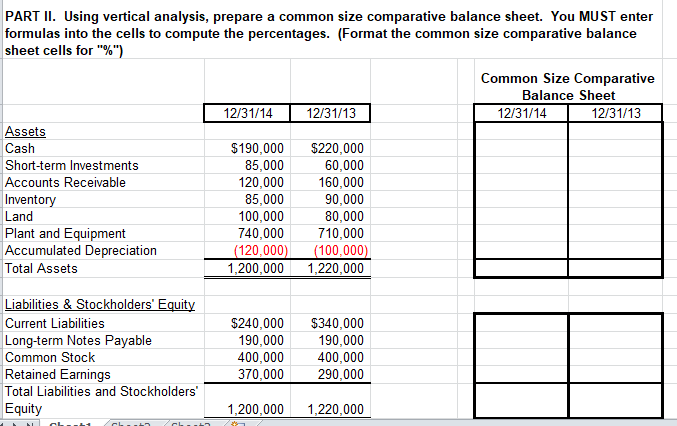
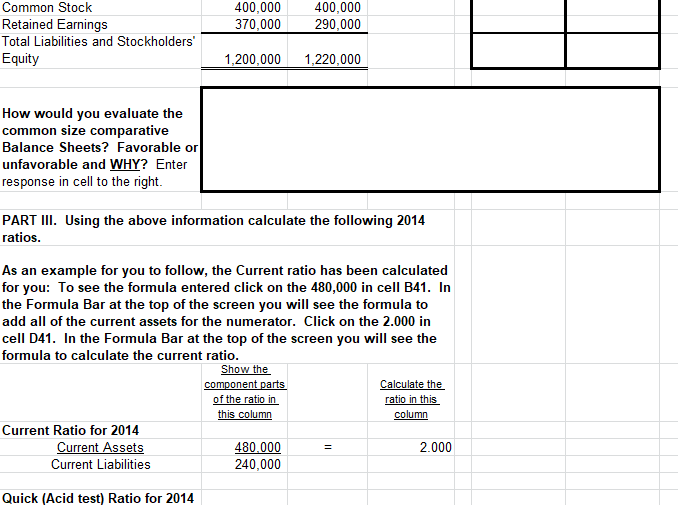
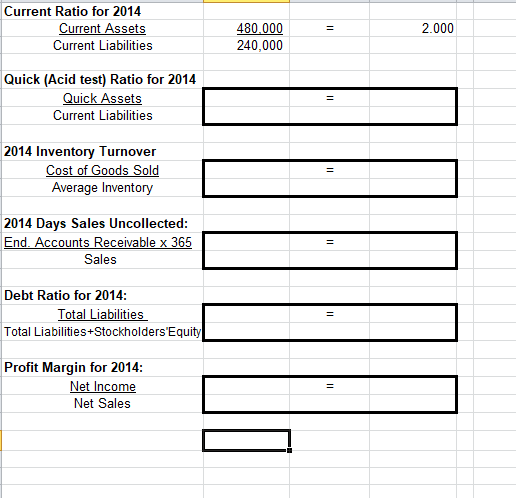
Yr Ended 12/31/12 PART I. Using horizontal analysis and 2012 as the base year, calculate Trend Percentages for each of the Income Statement items. You MUST enter formulas into the cells to compute the percentages. (Format the Trend Percentage cells for "%") Trend Percentages Yr Ended YrEnded Yr Ended Yr Ended YrEnded 12/31/14 12/31/13 12/31/12 12/31/14 12/31/13 Sales $800,000 $700,000 $500,000 Less Cost of Goods Sold 510,000 430,000 290,000 Gross Profit 290,000 270,000 210,000 Less General & Admin expenses 75,000 70,000 55,000 Less Selling Expenses 80,000 70,000 40,000 Net Income 135,000 130,000 115,000 Are the above trends favorable or unfavorable? EXPLAIN WHY. Enter response in cell to the right. PART II. Using vertical analysis, prepare a common size comparative balance sheet. You MUST enter formulas into the cells to compute the percentages. (Format the common size comparative balance sheet cells for "%") Common Size Comparative Balance Sheet 12/31/14 12/31/13 12/31/14 12/31/13 Assets Cash $190,000 $220,000 Short-term Investments 85,000 60,000 Accounts Receivable 120,000 160,000 Inventory 85,000 90,000 Land 100,000 80,000 Plant and Equipment 740,000 710,000 Accumulated Depreciation (120,000) (100,000) Total Assets 1,200,000 1,220,000 Liabilities & Stockholders' Equity Current Liabilities Long-term Notes Payable Common Stock Retained Earnings Total Liabilities and Stockholders' Equity $240,000 190,000 400,000 370,000 $340,000 190,000 400,000 290,000 1,200,000 1,220,000 400,000 370,000 400,000 290,000 Common Stock Retained Earnings Total Liabilities and Stockholders' Equity 1,200,000 1,220,000 How would you evaluate the common size comparative Balance Sheets? Favorable or unfavorable and WHY? Enter response in cell to the right. PART III. Using the above information calculate the following 2014 ratios. As an example for you to follow, the Current ratio has been calculated for you: To see the formula entered click on the 480,000 in cell B41. In the Formula Bar at the top of the screen you will see the formula to add all of the current assets for the numerator. Click on the 2.000 in cell D41. In the Formula Bar at the top of the screen you will see the formula to calculate the current ratio. Show the component parts Calculate the of the ratio in ratio in this this column column Current Ratio for 2014 Current Assets 480.000 2.000 Current Liabilities 240,000 Quick (Acid test) Ratio for 2014 Current Ratio for 2014 Current Assets Current Liabilities 2.000 480.000 240,000 Quick (Acid test) Ratio for 2014 Quick Assets Current Liabilities = 2014 Inventory Turnover Cost of Goods Sold Average Inventory = 2014 Days Sales Uncollected: End. Accounts Receivable x 365 Sales Debt Ratio for 2014: Total Liabilities Total Liabilities+Stockholders'Equity Profit Margin for 2014: Net Income Net Sales
Step by Step Solution
There are 3 Steps involved in it

Get step-by-step solutions from verified subject matter experts