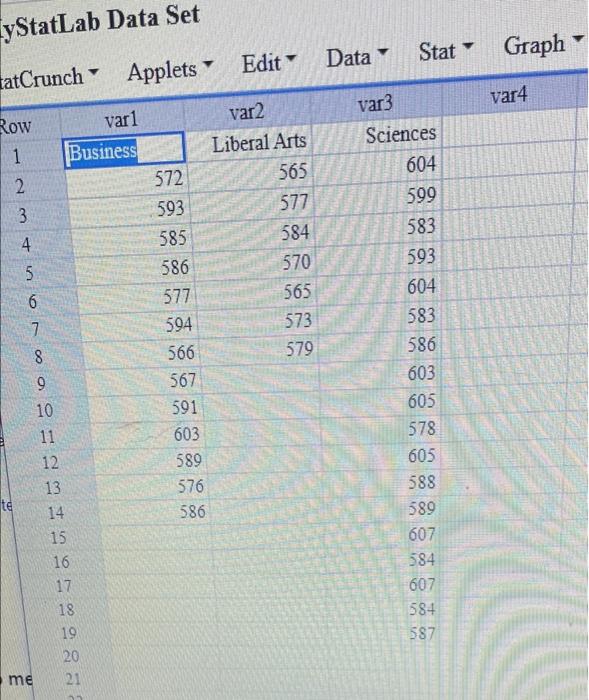
Question: yStatLab Data Set Stat Graph Edit Data Applets tatCrunch var4 var2 Liberal Arts var3 Sciences 604 565 599 577 584 570 565 573 579 583

yStatLab Data Set Stat Graph Edit Data Applets
yStatLab Data Set Stat Graph Edit Data Applets tatCrunch var4 var2 Liberal Arts var3 Sciences 604 565 599 577 584 570 565 573 579 583 593 604 o coo Row var1 1 Business 2 572 3 593 4 585 5 586 6 577 7 594 8 566 9 567 10 591 11 603 12 589 13 576 te 14 586 15 16 17 18 19 20 me 21 583 586 603 605 578 605 588 589 607 584 607 584 587 Question 1, 7.4.43 Part 2 of 4 HW Score: 28.57%, 0.57 of 2 points Points: 0.29 of 1 omework: Chapter 7: ANOVA ge is trying to determine if there is a significant difference in the mean GMAT score of students from different undergraduate backgrounds wh rogram The accompanying GMAT Scores data comes from a sample of students. What conclusion can be reached using ANOVA? Click the icon to view the GMAT Scores data. termine the null hypothesis and the alternative hypothesis 10 He at least one mean is different from the others Find the F-test statistic FLE (Type an integer or decimal rounded to two decimal places as needed)

Step by Step Solution

There are 3 Steps involved in it

1 Expert Approved Answer
Step: 1 Unlock blur-text-image
Question Has Been Solved by an Expert!

Get step-by-step solutions from verified subject matter experts

Step: 2 Unlock
Step: 3 Unlock

Students Have Also Explored These Related General Management Questions!