

Question: ZOOM 1.) [10 pts] The data set contains bath qualitative (mtegarical) and quantitative (numerical) variables. Identify each at the eight variables from the dataset as
![ZOOM 1.) [10 pts] The data set contains bath qualitative (mtegarical)](https://s3.amazonaws.com/si.experts.images/answers/2024/06/6668add606a66_2776668add5d6b85.jpg)

![of the categories below. Qualitative Variables Quantitative Variables 2.] For this part,](https://s3.amazonaws.com/si.experts.images/answers/2024/06/6668add762bc9_2796668add73d0ad.jpg)

![a.) [1 pt] Which Of the qualitative variables did you choose to](https://s3.amazonaws.com/si.experts.images/answers/2024/06/6668add832610_2806668add811e16.jpg)
![analyze? b.) [4 pts] Create a relative frequency distribution that summarizes the](https://s3.amazonaws.com/si.experts.images/answers/2024/06/6668add8a16b2_2806668add87d82b.jpg)
![qualitative variable. c.) [5 pts] Create an appropriate graph that displays the](https://s3.amazonaws.com/si.experts.images/answers/2024/06/6668add91100a_2806668add8de126.jpg)

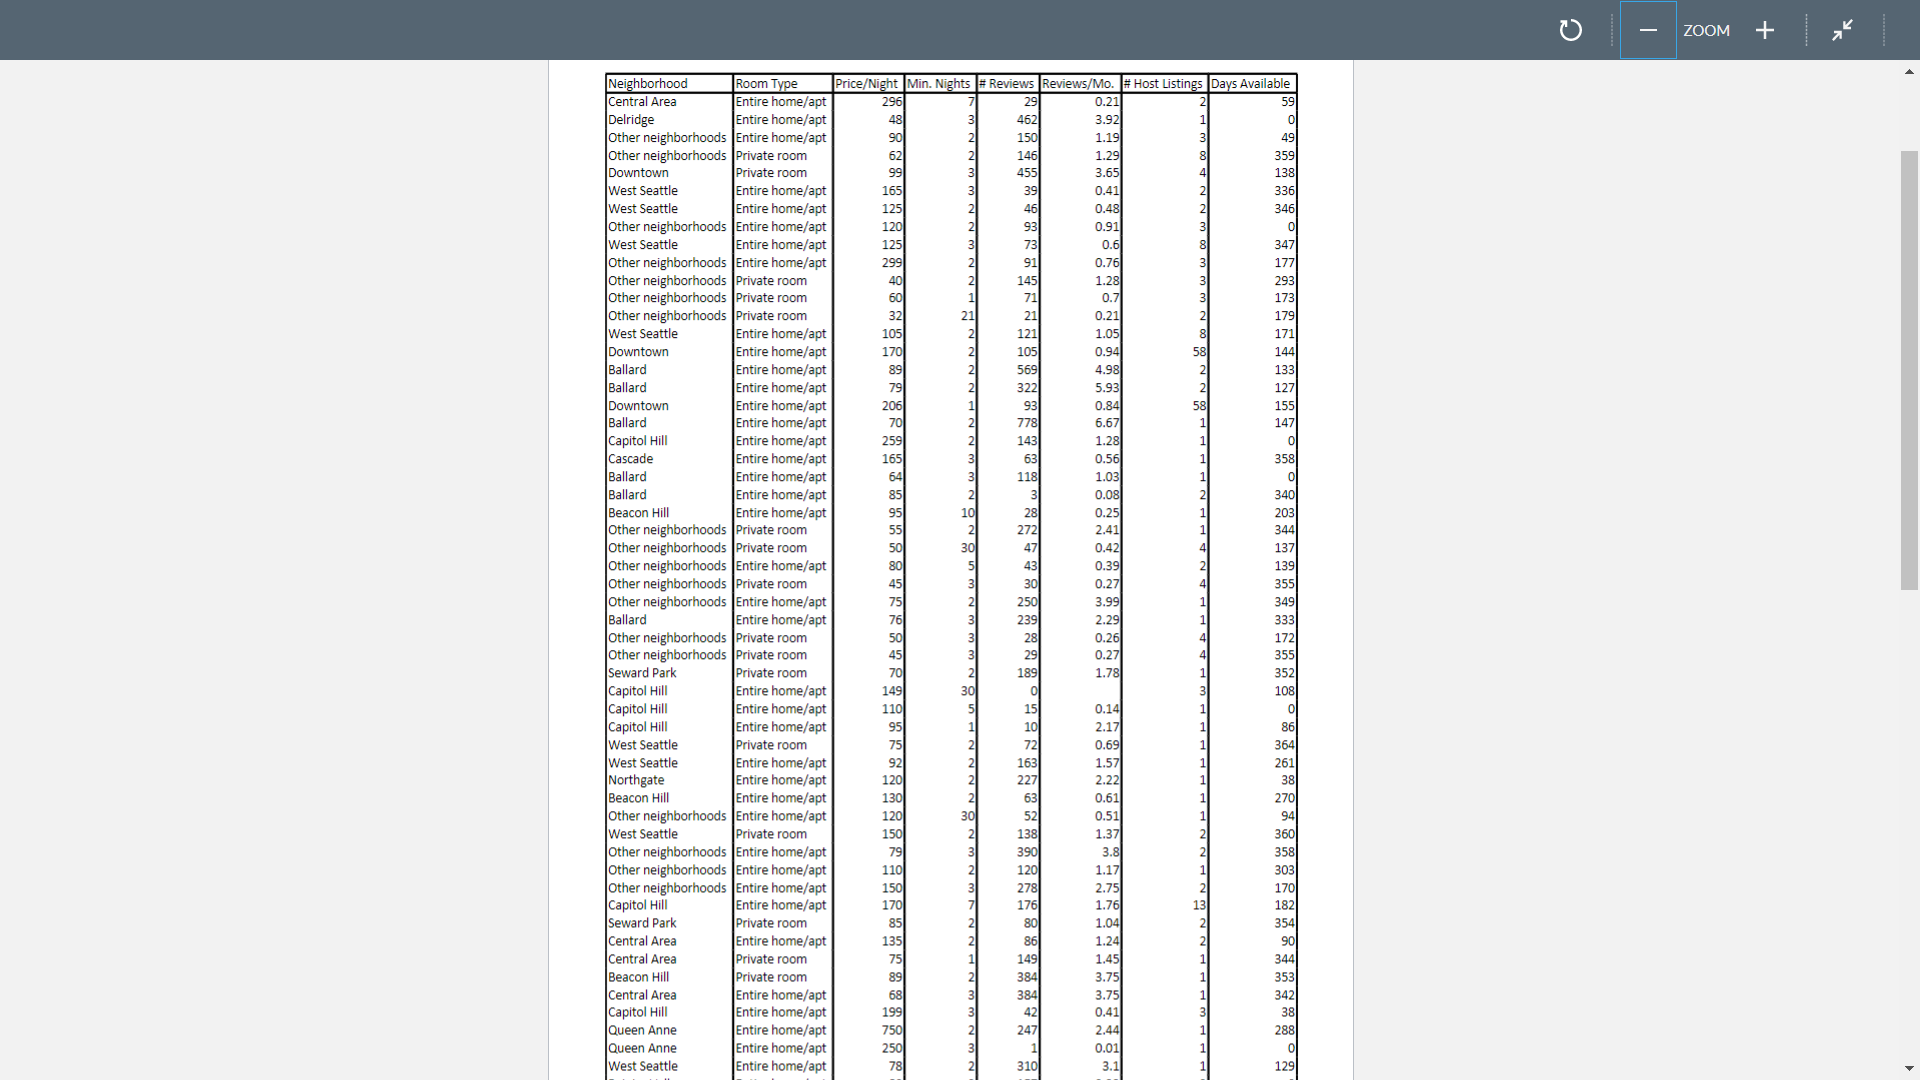
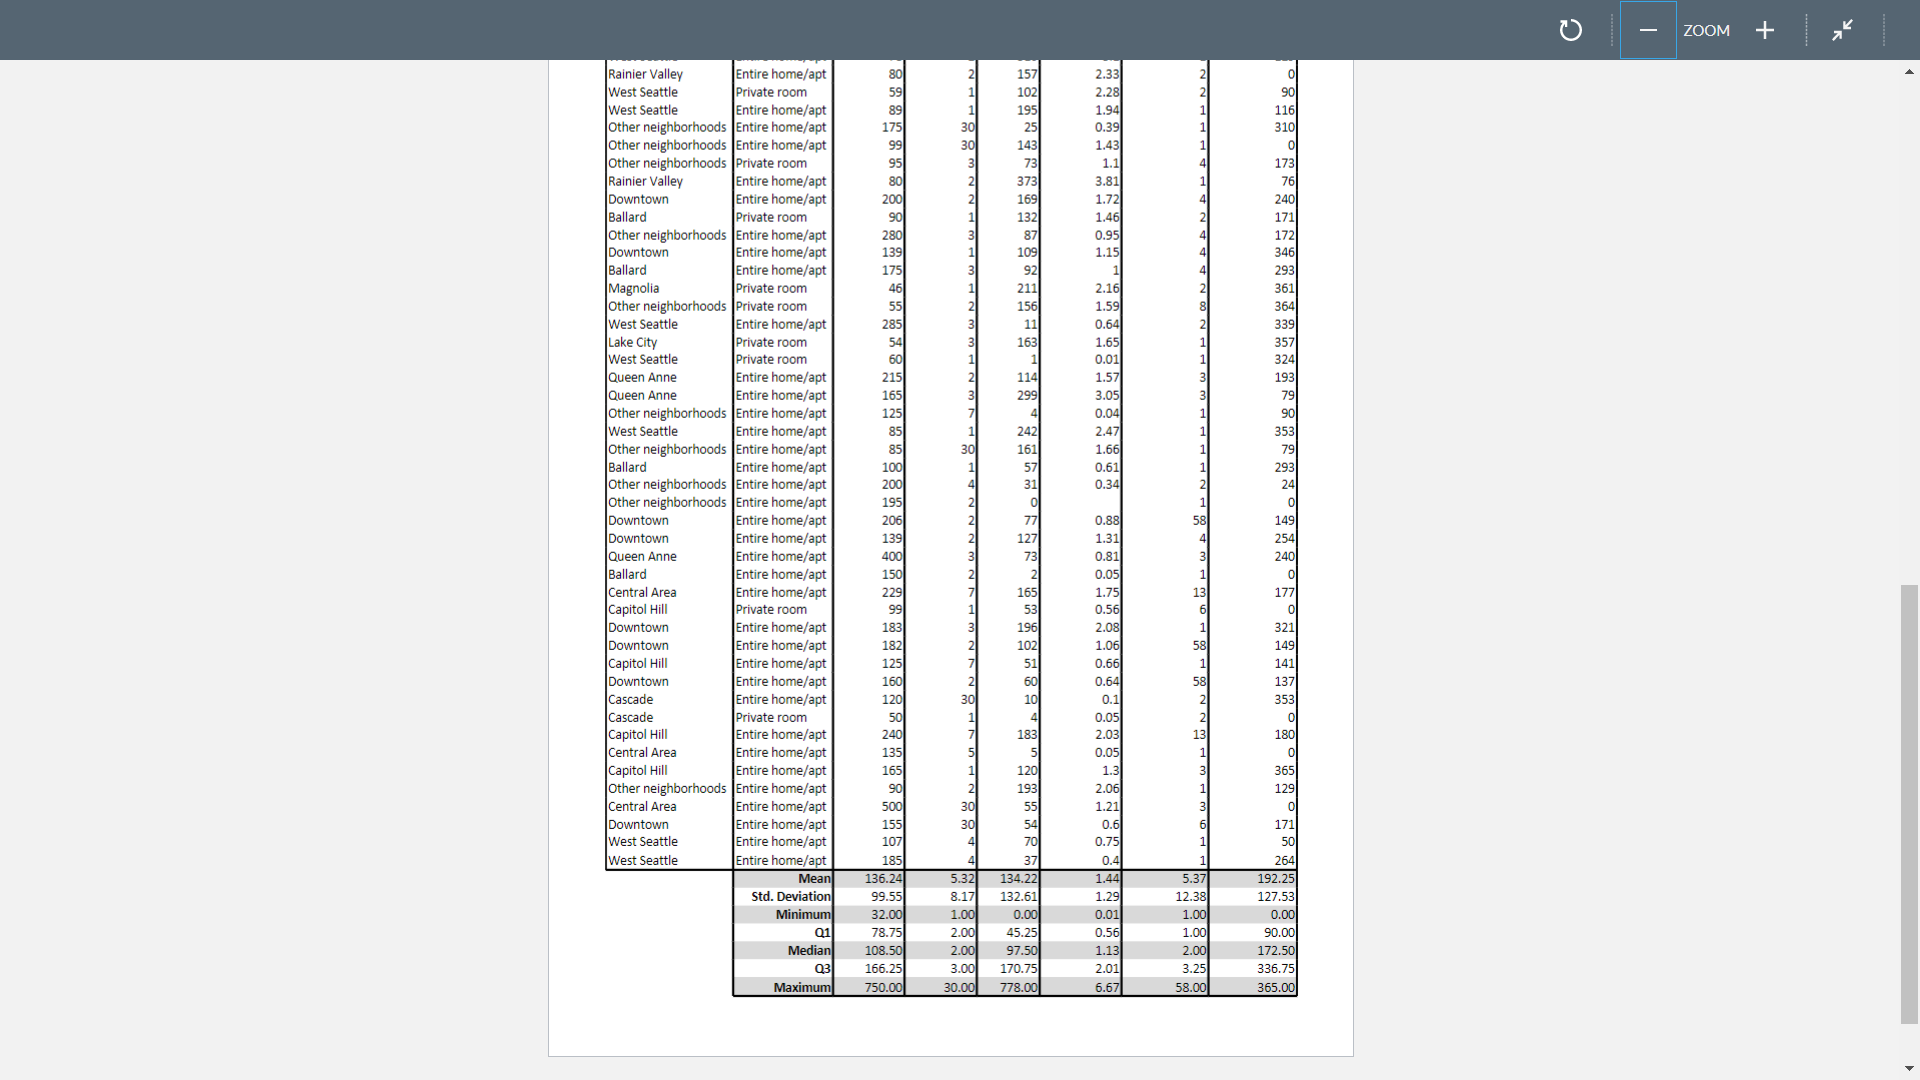
ZOOM 1.) [10 pts] The data set contains bath qualitative (mtegarical) and quantitative (numerical) variables. Identify each at the eight variables from the dataset as either qualitative or quantitative by listing each one under one of the categories below. Qualitative Variables Quantitative Variables 2.] For this part, choose only one of the qualitative variables from the dataset to analyze. a.) [1 pt] Which Of the qualitative variables did you choose to analyze? b.) [4 pts] Create a relative frequency distribution that summarizes the qualitative variable. c.) [5 pts] Create an appropriate graph that displays the qualitative variable you chose to analyze. Graphing by hand is just ne, but you are welcome to use any soltware you would like to create the graph. Page
Step by Step Solution
There are 3 Steps involved in it

Get step-by-step solutions from verified subject matter experts