

Question: Zoom Insert Table Chart Text Shape Media Comment The variables are spending (US $), duration of shopping (minutes), age (years) gender (0 = male, 1
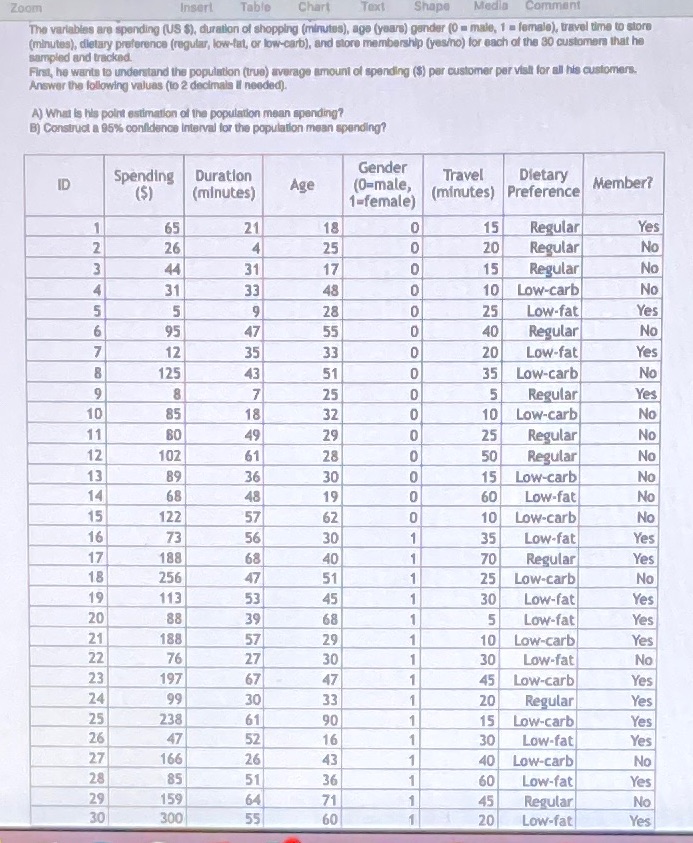
Zoom Insert Table Chart Text Shape Media Comment The variables are spending (US $), duration of shopping (minutes), age (years) gender (0 = male, 1 = female), travel time to store (minutes), dietary preference (regular, low-fat, or low-carb], and store membership (yesino) for each of the 30 customers that ha sampled and tracked First, he wants to understand the population (true) average amount of spending ($) per customer per visit for all his customers. Answer the following valuas (to 2 decimals I needed). A) What is his point estimation of the population mean spending? B) Construct a 95 confidence Interval for the population mean spending? Spending Duration Gender Travel Dietary ID ($) (minutes) Age (0=male, 1=female) (minutes) Preference Member? 65 21 18 0 15 Regular Yes 26 4 25 20 Regular No No AWN 44 31 17 0 15 Regular 31 33 48 10 Low-carb No 5 9 28 0 25 Low-fat Yes 95 47 55 40 Regular No 12 35 33 20 Low-fat Yes 125 43 51 35 Low-carb No 8 7 25 5 Regular Yes 10 85 18 32 10 Low-carb No 11 49 29 0 25 Regular No 12 102 61 28 0 50 Regular No 13 89 36 30 O 15 Low-carb No 14 68 48 19 0 60 Low-fat No 15 122 57 62 0 10 Low-carb No 16 73 56 30 35 Low-fat Yes 17 188 68 40 70 Regular Yes 18 256 47 51 1 25 Low-carb No 19 113 53 45 1 30 Low-fat Yes 20 88 39 68 1 5 Low-fat Yes 21 188 57 29 10 Low-carb Yes 22 76 27 30 30 Low-fat No 23 197 67 47 45 Low-carb Yes 24 99 30 33 1 20 Regular Yes 25 238 61 90 1 15 Low-carb Yes 26 47 52 16 1 30 Low-fat Yes 27 166 26 43 1 40 Low-carb No 28 85 51 36 60 Low-fat Yes 29 159 64 71 45 Regular No 30 300 55 60 20 Low-fat Yes
Step by Step Solution
There are 3 Steps involved in it

Get step-by-step solutions from verified subject matter experts