

Question: Consider the air pollution and mortality data given in Table B.15. a. Is there a problem with collinearity? Discuss how you arrived at this decision.
Consider the air pollution and mortality data given in Table B.15.
a. Is there a problem with collinearity? Discuss how you arrived at this decision.
b. Perform a ridge trace on these data.
c. Select a \(k\) based upon the ridge trace from part \(b\). Which estimates of the coefficients do you prefer for these data, ridge or OLS? Justify your answer.
d. Use principal-component regression to analyze these data. Discuss the principal-component regression results with the ridge regression and OLS results.
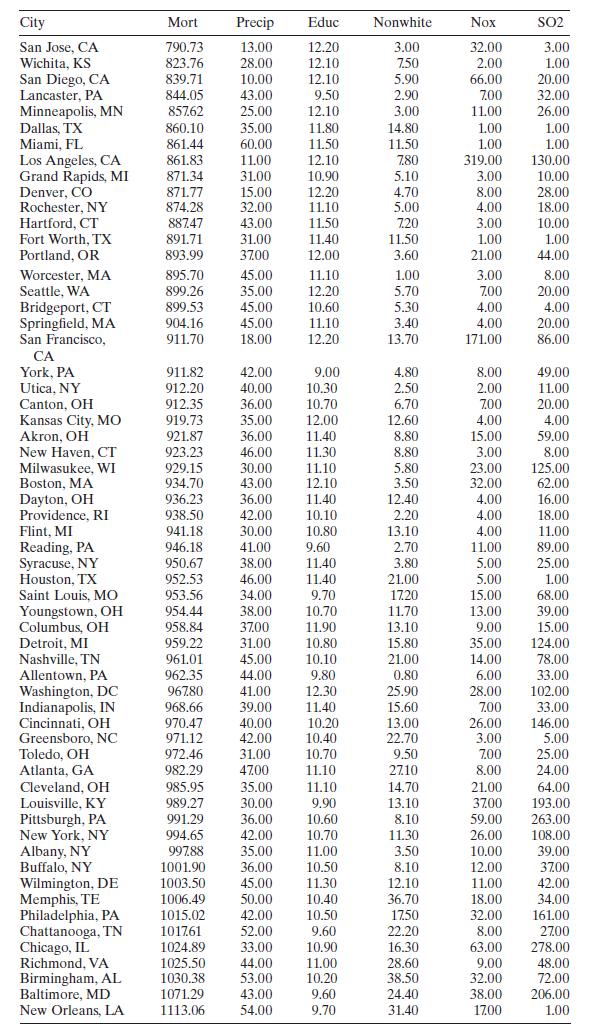
City Mort Precip Educ Nonwhite Nox SO2 San Jose, CA 790.73 13.00 12.20 3.00 32.00 3.00 Wichita, KS 823.76 28.00 12.10 7.50 2.00 1.00 San Diego, CA 839.71 10.00 12.10 5.90 66.00 20.00 Lancaster, PA 844.05 43.00 9.50 2.90 7.00 32.00 Minneapolis, MN 857.62 25.00 12.10 3.00 11.00 26.00 Dallas, TX 860.10 35.00 11.80 14.80 1.00 1.00 Miami, FL 861.44 60.00 11.50 11.50 1.00 1.00 Los Angeles, CA 861.83 11.00 12.10 7.80 319.00 130.00 Grand Rapids, MI 871.34 31.00 10.90 5.10 3.00 10.00 Denver, CO 871.77 15.00 12.20 4.70 8.00 28.00 Rochester, NY 874.28 32.00 11.10 5.00 4.00 18.00 Hartford, CT 887.47 43.00 11.50 7.20 3.00 10.00 Fort Worth, TX 891.71 31.00 11.40 11.50 1.00 1.00 Portland, OR 893.99 37.00 12.00 3.60 21.00 44.00 Worcester, MA 895.70 45.00 11.10 1.00 3.00 8.00 Seattle, WA 899.26 35.00 12.20 5.70 7.00 20.00 Bridgeport, CT 899.53 45.00 10.60 5.30 4.00 4.00 Springfield, MA 904.16 45.00 11.10 3.40 4.00 20.00 San Francisco, 911.70 18.00 12.20 13.70 171.00 86.00 CA York, PA 911.82 42.00 9.00 4.80 8.00 49.00 Utica, NY 912.20 40.00 10.30 2.50 2.00 11.00 Canton, OH 912.35 36.00 10.70 6.70 7.00 20.00 Kansas City, MO 919.73 35.00 12.00 12.60 4.00 4.00 Akron, OH 921.87 36.00 11.40 8.80 15.00 59.00 New Haven, CT 923.23 46.00 11.30 8.80 3.00 8.00 Milwaukee, WI 929.15 30.00 11.10 5.80 23.00 125.00 Boston, MA 934.70 43.00 12.10 3.50 32.00 62.00 Dayton, OH 936.23 36.00 11.40 12.40 4.00 16.00 Providence, RI 938.50 42.00 10.10 2.20 4.00 18.00 Flint, MI 941.18 30.00 10.80 13.10 4.00 11.00 Reading, PA 946.18 41.00 9.60 2.70 11.00 89.00 Syracuse, NY 950.67 38.00 11.40 3.80 5.00 25.00 Houston, TX 952.53 46.00 11.40 21.00 5.00 1.00 Saint Louis, MO 953.56 34.00 9.70 17.20 15.00 68.00 Youngstown, OH 954.44 38.00 10.70 11.70 13.00 39.00 Columbus, OH 958.84 37.00 11.90 13.10 9.00 15.00 Detroit, MI 959.22 31.00 10.80 15.80 35.00 124.00 Nashville, TN 961.01 45.00 10.10 21.00 14.00 78.00 Allentown, PA 962.35 44.00 9.80 0.80 6.00 33.00 Washington, DC 967.80 41.00 12.30 25.90 28.00 102.00 Indianapolis, IN 968.66 39.00 11.40 15.60 7.00 33.00 Cincinnati, OH 970.47 40.00 10.20 13.00 26.00 146.00 Greensboro, NC 971.12 42.00 10.40 22.70 3.00 5.00 Toledo, OH 972.46 31.00 10.70 9.50 7.00 25.00 Atlanta, GA 982.29 4700 11.10 2710 8.00 24.00 Cleveland, OH 985.95 35.00 11.10 14.70 21.00 64.00 Louisville, KY 989.27 30.00 9.90 13.10 37.00 193.00 Pittsburgh, PA 991.29 36.00 10.60 8.10 59.00 263.00 New York, NY 994.65 42.00 10.70 11.30 26.00 108.00 Albany, NY 997.88 35.00 11.00 3.50 10.00 39.00 Buffalo, NY 1001.90 36.00 10.50 8.10 12.00 37.00 Wilmington, DE 1003.50 45.00 11.30 12.10 11.00 42.00 Memphis, TE 1006.49 50.00 10.40 36.70 18.00 34.00 Philadelphia, PA 1015.02 42.00 10.50 1750 32.00 161.00 Chattanooga, TN 1017.61 52.00 9.60 22.20 8.00 2700 Chicago, IL 1024.89 33.00 10.90 16.30 63.00 278.00 Richmond, VA 1025.50 44.00 11.00 28.60 9.00 48.00 Birmingham, AL 1030.38 53.00 10.20 38.50 32.00 72.00 Baltimore, MD 1071.29 43.00 9.60 24.40 38.00 206.00 New Orleans, LA 1113.06 54.00 9.70 31.40 1700 1.00
Step by Step Solution
3.43 Rating (159 Votes )
There are 3 Steps involved in it

Get step-by-step solutions from verified subject matter experts