

Question: Consider the baseball data in Table B.22. Fit a regression model to team wins using total runs scored as the predictor. How does that model
Consider the baseball data in Table B.22. Fit a regression model to team wins using total runs scored as the predictor. How does that model compare to the one developed in Section 2.8 using team ERA as the predictor?
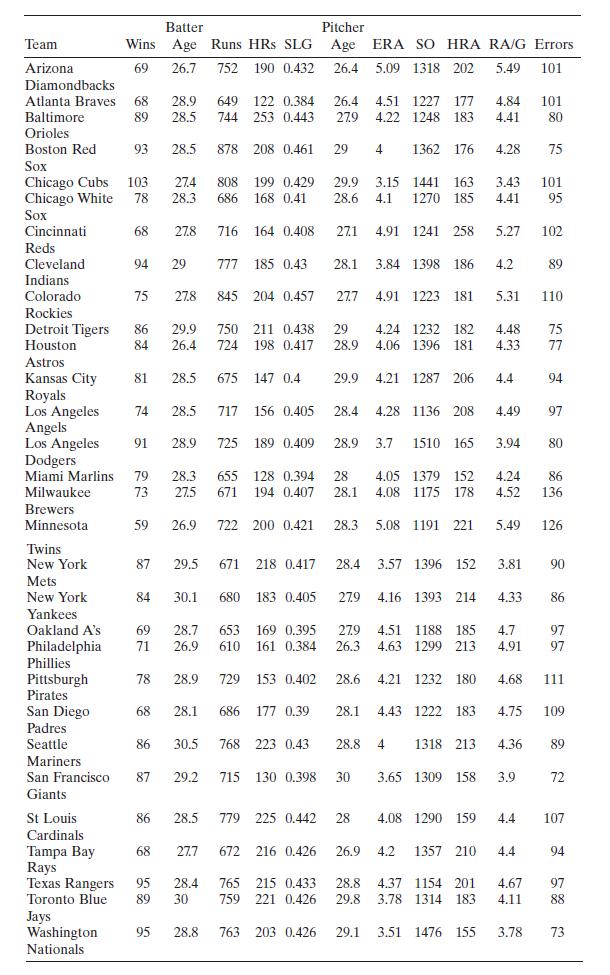
Rockies 878 208 0.461 29 4.51 1227 177 4.84 101 4.22 1248 183 4.41 4 1362 176 4.28 3.43 101 95 199 0.429 29.9 3.15 1441 163 4.1 1270 185 4.41 4.91 1241 258 5.27 102 3.84 1398 186 4.2 27.7 4.91 1223 181 5.31 89 80 75 110 75 77 94 97 Team Arizona Diamondbacks Atlanta Braves Baltimore Orioles Boston Red Sox 69 26.7 752 190 0.432 Batter Pitcher Wins Age Runs HRS SLG Age ERA SO HRA RA/G Errors 26.4 5.09 1318 202 5.49 101 68 Chicago Cubs 103 Chicago White Sox Cincinnati Reds Cleveland Indians Colorado 8 89 28.5 28.9 649 744 122 0.384 253 0.443 93 28.5 27.4 808 78 28.3 686 168 0.41 68 27.8 716 164 0.408 75 29 27.8 777 185 0.43 845 204 0.457 Detroit Tigers Houston Astros Kansas City Royals Los Angeles Angels Los Angeles Dodgers Miami Marlins Milwaukee Brewers Minnesota Twins New York Mets New York Yankees Oakland A's Philadelphia Phillies Pittsburgh Pirates San Diego Padres Seattle Mariners San Francisco Giants St Louis Cardinals 84 81 87 29.5 671 218 0.417 87 29.2 715 130 0.398 86 28.5 779 225 0.442 84 30.1 680 183 0.405 69 28.7 653 169 0.395 71 26.9 610 161 0.384 78 28.9 729 153 0.402 28.1 686 177 0.39 86 30.5 768 223 0.43 29.9 26.4 750 211 0.438 4.24 1232 182 4.48 724 198 0.417 28.9 4.06 1396 181 4.33 28.5 675 147 0.4 29.9 4.21 1287 206 4.4 74 28.5 717 156 0.405 28.4 4.28 1136 208 4.49 91 28.9 725 189 0.409 28.9 3.7 1510 165 3.94 79 28.3 655 128 0.394 4.05 1379 152 4.24 86 73 27.5 671 194 0.407 28.1 4.08 1175 178 4.52 136 59 26.9 722 200 0.421 5.08 1191 221 5.49 126 28.4 3.57 1396 152 3.81 27.9 4.16 1393 214 4.33 90 86 27.9 4.51 1188 185 4.7 26.3 4.63 1299 213 4.91 28.6 4.21 1232 180 4.68 4.43 1222 183 4.75 4 1318 213 4.36 3.65 1309 158 3.9 Tampa Bay 68 27.7 672 216 0.426 Rays Texas Rangers 95 Toronto Blue 89 28.4 765 215 0.433 30 759 221 0.426 Jays Washington 95 28.8 763 203 0.426 Nationals 4.08 1290 159 4.4 4.2 1357 210 4.4 4.37 1154 201 4.67 3.78 1314 183 4.11 3.51 1476 155 3.78
Step by Step Solution
There are 3 Steps involved in it

Get step-by-step solutions from verified subject matter experts