

Question: Consider the life expectancy data given in Problem 3.16 and Table B.16. Problem 3.16 Rossman [1994] presents an interesting study of average life expectancy of
Consider the life expectancy data given in Problem 3.16 and Table B.16.
Problem 3.16
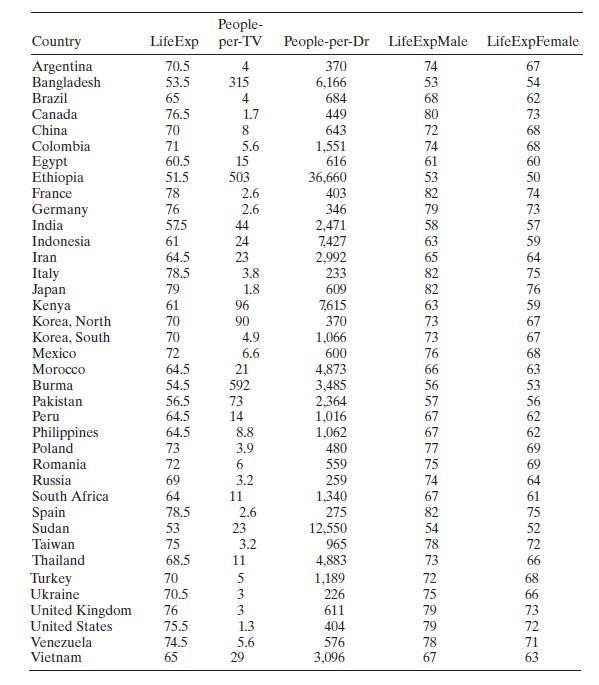
Rossman [1994] presents an interesting study of average life expectancy of 40 countries. Table B. 16 gives the data. The study has three responses: LifeExp is the overall average life expectancy. LifeExpMale is the average life expectancy for males, and LifeExpFemale is the average life expectancy for females. The regressors are People-per-TV, which is the average number of people per television, and People-per-Dr, which is the average number of people per physician.
a. For each model construct a normal probability plot of the residuals from the full model. Does there seem to be any problem with the normality assumption?
b. For each model construct and interpret a plot of the residuals versus the predicted response.
Country People- Life Exp per-TV People-per-Dr LifeExpMale LifeExpFemale Argentina Bangladesh 70.5 4 370 74 67 53.5 315 6,166 53 54 Brazil 65 4 684 68 62 Canada 76.5 1.7 449 80 73 China 70 8 643 72 68 Colombia 71 5.6 1,551 74 68 Egypt 60.5 15 616 61 60 Ethiopia 51.5 503 36,660 53 50 France 78 2.6 Germany 76 2.6 66 403 82 74 346 79 73 India 575 44 2,471 58 57 Indonesia 61 24 7,427 63 59 Iran 64.5 23 2,992 65 64 Italy 78.5 3.8 233 82 75 Japan 79 1.8 609 82 76 Kenya 61 96 7,615 63 59 Korea, North 70 90 370 73 67 Korea, South 70 4.9 1,066 Mexico 72 6.6 600 Morocco 64.5 21 4,873 Burma 54.5 592 3,485 Pakistan 56.5 73 2,364 Peru 64.5 14 1,016 Philippines 64.5 8.8 1,062 Poland 73 3.9 480 Romania 72 559 Russia 69 3.2 259 South Africa 64 11 1,340 Spain 78.5 2.6 275 Sudan 53 23 12,550 Taiwan 75 3.2 965 Thailand 68.5 11 4,883 Turkey 70 70 Ukraine 70.5 United Kingdom 76 533 5 1,189 72 3 226 3 611 79 United States 75.5 1.3 404 79 Venezuela 74.5 5.6 576 Vietnam 65 29 3,096 67 FREE6 6 6 F F 2 6 825 73 67 76 68 66 63 56 53 57 56 67 62 67 62 77 69 75 69 74 64 67 61 75 52 72 73 66 68 75 66 73 72 78 71 63
Step by Step Solution
3.40 Rating (163 Votes )
There are 3 Steps involved in it

Get step-by-step solutions from verified subject matter experts