

Question: Consider the nonlinear regression model fit to the data in Problem 12.11. Find approximate (95 %) bootstrap confidence intervals for the regression coefficients (hat{theta}_{1}, hat{theta}_{2}),
Consider the nonlinear regression model fit to the data in Problem 12.11. Find approximate \(95 \%\) bootstrap confidence intervals for the regression coefficients \(\hat{\theta}_{1}, \hat{\theta}_{2}\), and \(\hat{\theta}_{3}\) using \(m=1000\) bootstrap samples. Compare these intervals to the ones based on the large-sample results. Based on the comparison of these intervals, comment on how the asymptotic theory seems to apply to this problem.
Problem 12.11
Data From Problem 12.11
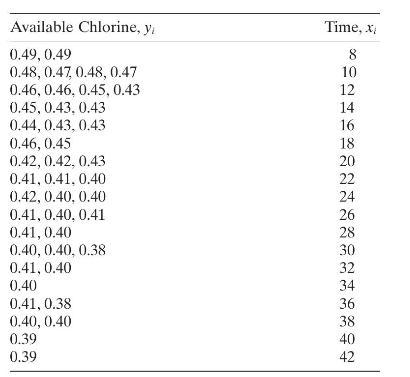
The data below represent the fraction of active chlorine in a chemical product as a function of time after manufacturing.
a. Construct a scatterplot of the data.
b. Fit the Mitcherlich law (see Problem 12.10) to these data. Discuss how you obtained the starting values.
Data From Problem 12.10
12.10 Consider the model
y=θ1−θ2e−θ3x+ε
This is called the Mitcherlich equation, and it is often used in chemical engineering. For example, y may be yield and x may be reaction time.
c. Test for significance of regression.
d. Find approximate 95% confidence intervals on the parameters θ1,θ2, and θ3. Is there evidence to support the claim that all three parameters are different from zero?
e. Analyze the residuals and comment on model adequacy.
Available Chlorine, y 0.49, 0.49 0.48, 0.47, 0.48, 0.47 Time, x 8 10 0.46, 0.46, 0.45, 0.43 12 0.45, 0.43, 0.43 14 0.44, 0.43, 0.43 16 0.46, 0.45 18 0.42, 0.42, 0.43 20 0.41, 0.41, 0.40 22 0.42, 0.40, 0.40 0.41, 0.40, 0.41 0.41, 0.40 0.40, 0.40, 0.38 24 26 28 30 0.41, 0.40 0.40 0.41, 0.38 0.40, 0.40 0.39 32 34 36 38 40 0.39 42
Step by Step Solution
There are 3 Steps involved in it

Get step-by-step solutions from verified subject matter experts