

Question: Table B. 15 presents data on air pollution and mortality. Use the all-possibleregressions selection on the air pollution data to find appropriate models for these
Table B. 15 presents data on air pollution and mortality. Use the all-possibleregressions selection on the air pollution data to find appropriate models for these data. Perform a thorough analysis of the best candidate models. Compare your results with stepwise regression. Thoroughly discuss your recommendations.
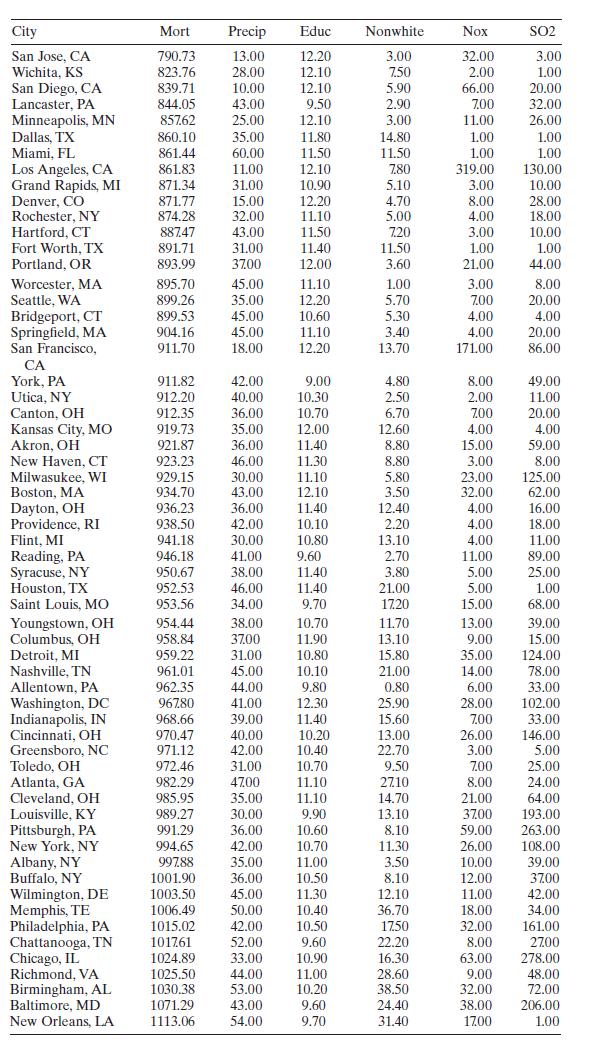
City Mort Precip Educ Nonwhite Nox SO2 San Jose, CA 790.73 13.00 12.20 3.00 32.00 3.00 Wichita, KS 823.76 28.00 12.10 7.50 2.00 1.00 San Diego, CA 839.71 10.00 12.10 5.90 66.00 20.00 Lancaster, PA 844.05 43.00 9.50 2.90 7.00 32.00 Minneapolis, MN 857.62 25.00 12.10 3.00 11.00 26.00 Dallas, TX 860.10 35.00 11.80 14.80 1.00 1.00 Miami, FL 861.44 60.00 11.50 11.50 1.00 1.00 Los Angeles, CA 861.83 11.00 12.10 7.80 319.00 130.00 Grand Rapids, MI 871.34 31.00 10.90 5.10 3.00 10.00 Denver, CO 871.77 15.00 12.20 4.70 8.00 28.00 Rochester, NY 874.28 32.00 11.10 5.00 4.00 18.00 Hartford, CT 887.47 43.00 11.50 7.20 3.00 10.00 Fort Worth, TX 891.71 31.00 11.40 11.50 1.00 1.00 Portland, OR 893.99 37.00 12.00 3.60 21.00 44.00 Worcester, MA 895.70 45.00 11.10 1.00 3.00 8.00 Seattle, WA 899.26 35.00 12.20 5.70 7.00 20.00 Bridgeport, CT 899.53 45.00 10.60 5.30 4.00 4.00 Springfield, MA 904.16 45.00 11.10 3.40 4.00 20.00 San Francisco, 911.70 18.00 12.20 13.70 171.00 86.00 CA York, PA 911.82 42.00 9.00 4.80 8.00 49.00 Utica, NY 912.20 40.00 10.30 2.50 2.00 11.00 Canton, OH 912.35 36.00 10.70 6.70 700 20.00 Kansas City, MO 919.73 35.00 12.00 12.60 4.00 4.00 Akron, OH 921.87 36.00 11.40 8.80 15.00 59.00 New Haven, CT 923.23 46.00 11.30 8.80 3.00 8.00 Milwaukee, WI 929.15 30.00 11.10 5.80 23.00 125.00 Boston, MA 934.70 43.00 12.10 3.50 32.00 62.00 Dayton, OH 936.23 36.00 11.40 12.40 4.00 16.00 Providence, RI 938.50 42.00 10.10 2.20 4.00 18.00 Flint, MI 941.18 30.00 10.80 13.10 4.00 11.00 Reading, PA 946.18 41.00 9.60 2.70 11.00 89.00 Syracuse, NY 950.67 38.00 11.40 3.80 5.00 25.00 Houston, TX 952.53 46.00 11.40 21.00 5.00 1.00 Saint Louis, MO 953.56 34.00 9.70 1720 15.00 68.00 Youngstown, OH 954.44 38.00 10.70 11.70 13.00 39.00 Columbus, OH 958.84 37.00 11.90 13.10 9.00 15.00 Detroit, MI 959.22 31.00 10.80 15.80 35.00 124.00 Nashville, TN 961.01 45.00 10.10 21.00 14.00 78.00 Allentown, PA 962.35 44.00 9.80 0.80 6.00 33.00 Washington, DC 967.80 41.00 12.30 25.90 28.00 102.00 Indianapolis, IN 968.66 39.00 11.40 15.60 7.00 33.00 Cincinnati, OH 970.47 40.00 10.20 13.00 26.00 146.00 Greensboro, NC 971.12 42.00 10.40 22.70 3.00 5.00 Toledo, OH 972.46 31.00 10.70 9.50 7.00 25.00 Atlanta, GA 982.29 47.00 11.10 2710 8.00 24.00 Cleveland, OH 985.95 35.00 11.10 14.70 21.00 64.00 Louisville, KY 989.27 30.00 9.90 13.10 37.00 193.00 Pittsburgh, PA 991.29 36.00 10.60 8.10 59.00 263.00 New York, NY 994.65 42.00 10.70 11.30 26.00 108.00 Albany, NY 997.88 35.00 11.00 3.50 10.00 39.00 Buffalo, NY 1001.90 36.00 10.50 8.10 12.00 37.00 Wilmington, DE 1003.50 45.00 11.30 12.10 11.00 42.00 Memphis, TE 1006.49 50.00 10.40 36.70 18.00 34.00 Philadelphia, PA 1015.02 42.00 10.50 1750 32.00 161.00 Chattanooga, TN 101761 52.00 9.60 22.20 8.00 2700 Chicago, IL 1024.89 33.00 10.90 16.30 63.00 278.00 Richmond, VA 1025.50 44.00 11.00 28.60 9.00 48.00 Birmingham, AL 1030.38 53.00 10.20 38.50 32.00 72.00 Baltimore, MD 1071.29 43.00 9.60 24.40 38.00 206.00 New Orleans, LA 1113.06 54.00 9.70 31.40 17.00 1.00
Step by Step Solution
3.43 Rating (150 Votes )
There are 3 Steps involved in it

Get step-by-step solutions from verified subject matter experts