

Question: Table B.23 contains player efficiency ratings (PER) from the 2016-17 and 2017-18 NBA combine that evaluates 60 rookies hoping to be drafted by NBA teams.
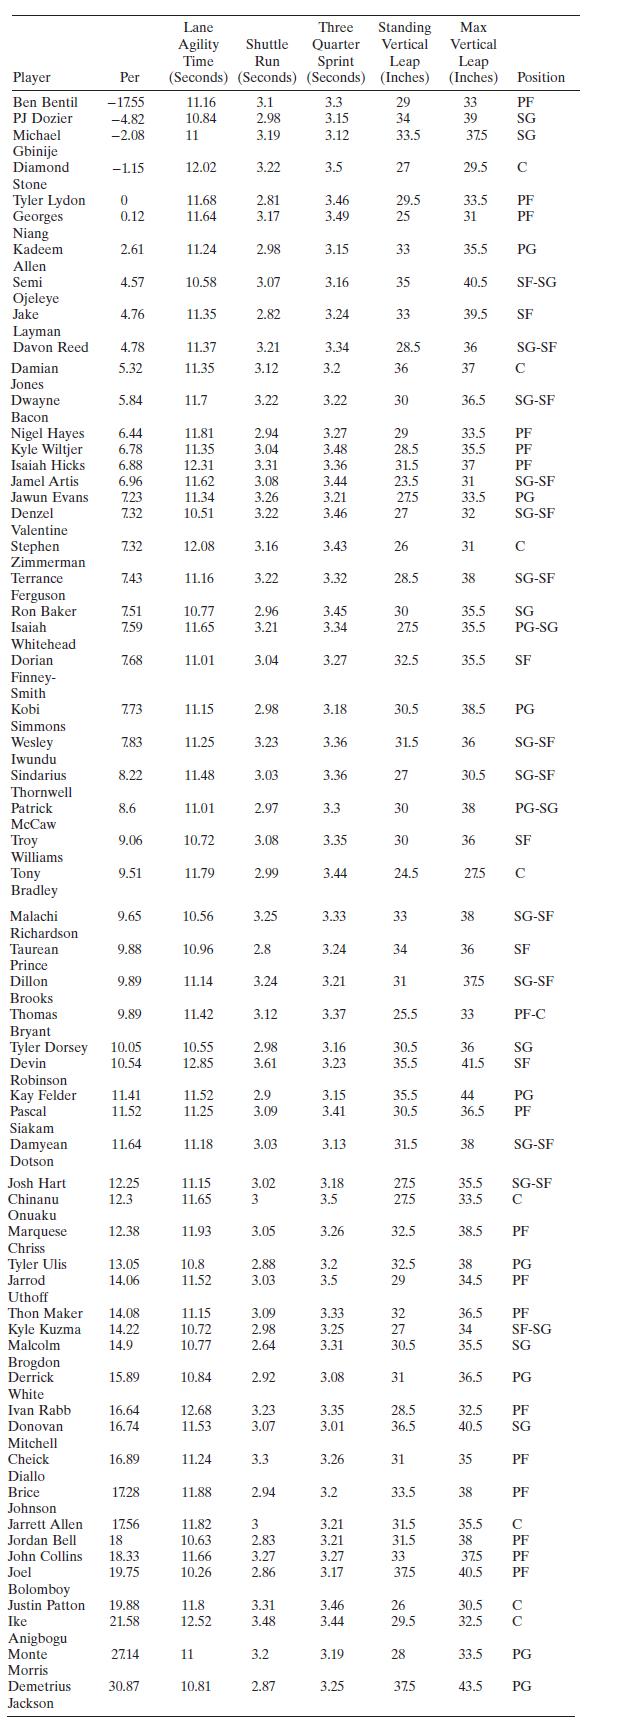
Table B.23 contains player efficiency ratings (PER) from the 2016-17 and 2017-18 NBA combine that evaluates 60 rookies hoping to be drafted by NBA teams. PER is a measure of a player's per-minute productivity that is a summation of positive contribution (such as points and assists) and minus negative ones (such as turnovers and missed field goal attempts). At the combine, the PER is computed using the factors lane agility, shuttle run time, three-quarter spring time, standing vertical leap, and maximum vertical leap. The player's position is also recorded. The five positions are point guard, small (shooting) guard, small forward/small guard, and center. The PER is hopefully and indicator of how the player will perform in his first or rookie year in the league.
a. Fit a regression model relating PER to only the continuous regressors. Evaluate the model in terms of fit and potential predictive performance.
b. The model that you found in part a can probably be improved by adding the player position information using indicator variables. Fit this model and compare it to the one from part a.
c. Fit a model similar to the one in part \(b\) but in addition using the interaction terms between the continuous regressors and the indicator variables. Evaluate this model and compare it to the ones from parts \(\mathrm{a}\) and \(\mathrm{b}\).
Lane Three Standing Max Agility Time Shuttle Run Quarter Sprint Player Per Ben Bentil -1755 11.16 3.1 3.3 PJ Dozier -4.82 10.84 2.98 3.15 Michael -2.08 11 3.19 3.12 Vertical Leap (Seconds) (Seconds) (Seconds) (Inches) (Inches) Position 33 39 37.5 Gbinije Diamond -1.15 12.02 3.22 3.5 Stone Tyler Lydon 0 11.68 2.81 3.46 Georges 0.12 11.64 3.17 3.49 Niang Kadeem 2.61 11.24 2.98 3.15 Allen Semi 4.57 10.58 3.07 3.16 Ojeleye Jake 4.76 11.35 2.82 3.24 Layman Davon Reed 4.78 11.37 3.21 3.34 Damian 5.32 11.35 3.12 3.2 Jones Dwayne 5.84 11.7 3.22 3.22 Bacon Nigel Hayes 6.44 11.81 2.94 3.27 Kyle Wiltjer 6.78 11.35 3.04 3.48 Isaiah Hicks 6.88 12.31 3.31 3.36 Jamel Artis 6.96 11.62 3.08 3.44 Jawun Evans 7.23 11.34 3.26 3.21 Denzel 7.32 10.51 3.22 3.46 Valentine Stephen 7.32 12.08 3.16 3.43 Zimmerman Terrance 7.43 11.16 3.22 3.32 Ferguson Ron Baker 7.51 10.77 2.96 3.45 Isaiah 7.59 11.65 3.21 3.34 Whitehead Dorian 7.68 11.01 3.04 3.27 RZ 36 37 882 2 2 2 2 2 2 2 2 2 22 2 29.5 33.5 31 35.5 40.5 39.5 31 33.5 32 PF SG-SF PG SG-SF 31 38 SG-SF 35.5 SG 35.5 PG-SG 35.5 SF 36.5 SG-SF 33.5 PF 35.5 PF 37 88 SF-SG SG-SF Finney- Smith Kobi 7.73 11.15 2.98 3.18 30.5 38.5 PG Simmons Wesley 7.83 11.25 3.23 3.36 31.5 36 SG-SF Iwundu Sindarius 8.22 11.48 3.03 3.36 27 30.5 SG-SF Thornwell Patrick 8.6 11.01 2.97 3.3 30 38 PG-SG McCaw Troy 9.06 10.72 3.08 3.35 30 36 SF Williams Tony 9.51 11.79 2.99 3.44 24.5 275 C Bradley Malachi 9.65 10.56 3.25 3.33 33 38 Richardson Taurean 9.88 10.96 2.8 3.24 34 Prince Dillon 9.89 11.14 3.24 3.21 31 Brooks Thomas 9.89 11.42 3.12 3.37 25.5 Bryant Tyler Dorsey 10.05 10.55 2.98 3.16 30.5 Devin 10.54 12.85 3.61 3.23 35.5 41.5 Robinson Kay Felder 11.41 11.52 2.9 3.15 35.5 Pascal 11.52 11.25 3.09 3.41 30.5 36.5 Siakam Damyean 11.64 11.18 3.03 3.13 31.5 Dotson Josh Hart 12.25 11.15 3.02 3.18 27.5 35.5 Chinanu 12.3 11.65 3 3.5 27.5 33.5 Onuaku Marquese 12.38 11.93 3.05 3.26 32.5 38.5 Chriss Tyler Ulis 13.05 10.8 2.88 3.2 32.5 38 Jarrod 14.06 11.52 3.03 3.5 29 34.5 Uthoff Thon Maker 14.08 11.15 3.09 3.33 32 Kyle Kuzma 14.22 10.72 2.98 3.25 27 Malcolm 14.9 10.77 2.64 3.31 30.5 35.5 SG Brogdon Derrick 15.89 10.84 2.92 3.08 31 36.5 White Ivan Rabb 16.64 12.68 3.23 3.35 28.5 32.5 Donovan 16.74 11.53 3.07 3.01 36.5 40.5 Mitchell Cheick 16.89 11.24 3.3 3.26 31 35 Diallo Brice 1728 11.88 2.94 3.2 33.5 38 Johnson Jarrett Allen 17.56 11.82 3 3.21 31.5 35.5 Jordan Bell 18 10.63 2.83 3.21 31.5 38 John Collins 18.33 11.66 3.27 3.27 33 37.5 Joel 19.75 10.26 2.86 3.17 37.5 40.5 8 ? SG-SF SF SG-SF SG-SF SG-SF C 36.5 PF 34 SF-SG Bolomboy Justin Patton 19.88 11.8 3.31 3.46 26 30.5 Ike 21.58 12.52 3.48 3.44 29.5 32.5 Anigbogu Monte 27.14 11 3.2 3.19 28 33.5 PG Morris Demetrius 30.87 10.81 2.87 3.25 375 43.5 PG Jackson
Step by Step Solution
3.32 Rating (155 Votes )
There are 3 Steps involved in it

Get step-by-step solutions from verified subject matter experts