

Question: The demand function for lumber products is thought to take the form P = AQb. Data were collected and displayed in the table below. One
The demand function for lumber products is thought to take the form P = AQ−b. Data were collected and displayed in the table below. One of your co-workers suggests a linear model regressing P on Q. Based on the anticipated function shown below, you suggest a doublelog model.
A. Using your preferred software estimate both models. Save the residuals.
B. Compare and contrast the results. What can you say about the elasticity of demand?
C. Plot the residuals. What can you conclude?
D. Can you compare the R2 values? Explain why or why not.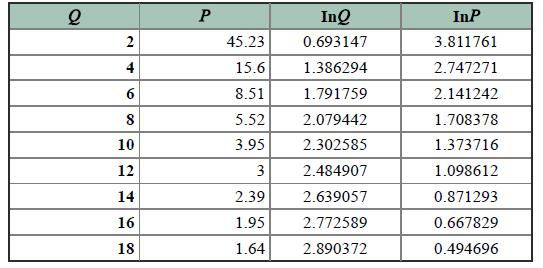
Q 2 4 60 8 10 12 14 16 18 P 45.23 15.6 8.51 5.52 3.95 3 2.39 1.95 1.64 InQ 0.693147 1.386294 1.791759 2.079442 2.302585 2.484907 2.639057 2.772589 2.890372 InP 3.811761 2.747271 2.141242 1.708378 1.373716 1.098612 0.871293 0.667829 0.494696
Step by Step Solution
3.44 Rating (163 Votes )
There are 3 Steps involved in it

Get step-by-step solutions from verified subject matter experts