

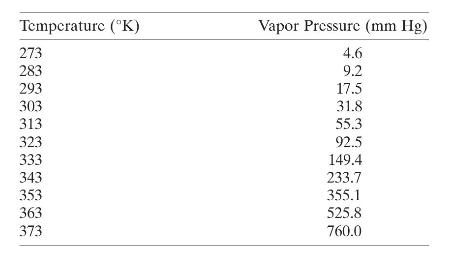
The following table gives the vapor pressure of water for various temperatures, previously reported in Exercise 5.2.
Question:
The following table gives the vapor pressure of water for various temperatures, previously reported in Exercise 5.2.
Exercise 5.2
The following table gives the vapor pressure of water for various temperatures
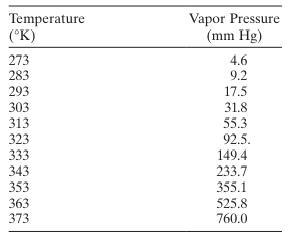
a. Plot a scatter diagram. Does it seem likely that a straight-line model will be adequate?
b. Fit the straight-line model. Compute the summary statistics and the residual plots. What are your conclusions regarding model adequacy?
c. From physical chemistry the Clausius-Clapeyron equation states that
\[
\ln \left(p_{v}\right) \propto-\frac{1}{T}
\]
Repeat part b using the appropriate transformation based on this information.
b. Fit the straight-line model. Compute the summary statistics and the residual plots. What are your conclusions regarding model adequacy?
d. Fit the appropriate non-linear model.
e. Discuss the differences in these models. Discuss which model you prefer.
Step by Step Answer:

This question has not been answered yet.
You can Ask your question!


Introduction To Linear Regression Analysis
ISBN: 9781119578727
6th Edition
Authors: Douglas C. Montgomery, Elizabeth A. Peck, G. Geoffrey Vining
