

Question: The table below shows the predicted values and deviance residuals for the Poisson regression model using (x_{2}=) bomb load as the regressor fit to the
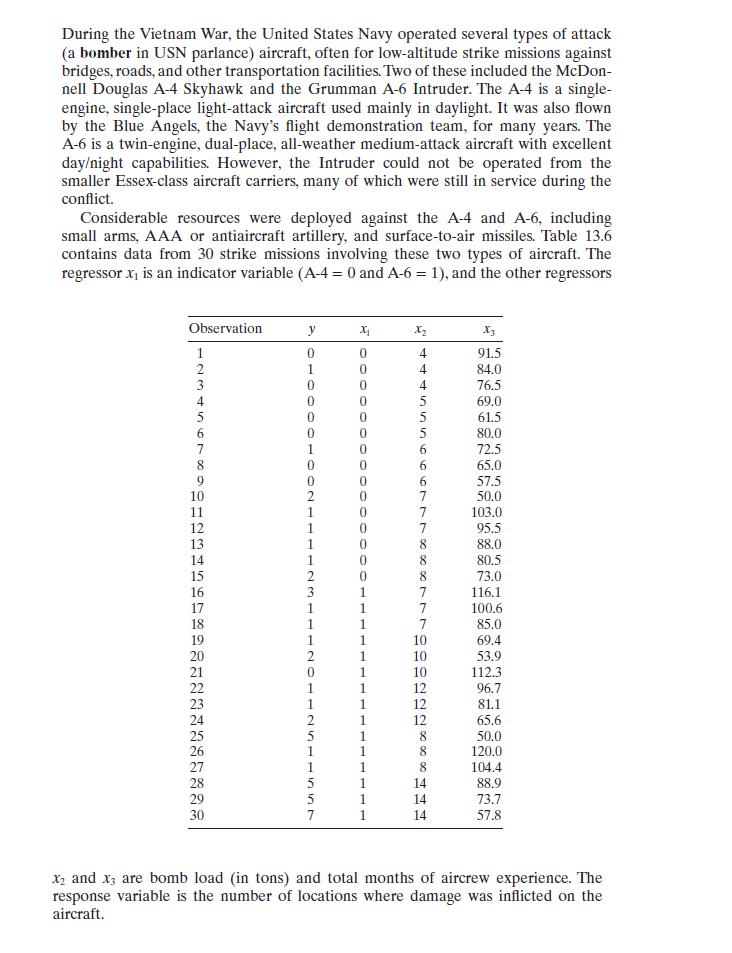
The table below shows the predicted values and deviance residuals for the Poisson regression model using \(x_{2}=\) bomb load as the regressor fit to the aircraft damage data in Example 13.8. Plot the residuals and comment on model adequacy.
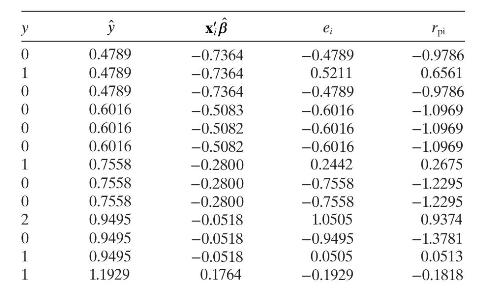
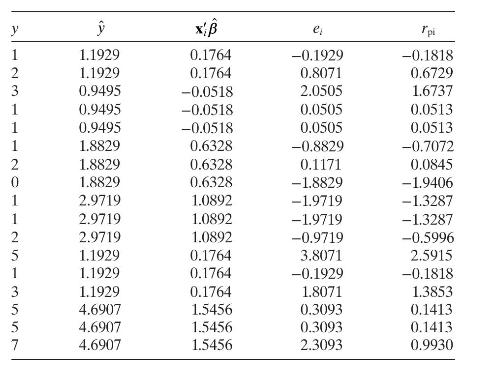
Example 13.8
y x B ei "pi 0 0.4789 -0.7364 -0.4789 -0.9786 1 0.4789 -0.7364 0.5211 0.6561 0 0.4789 -0.7364 -0.4789 -0.9786 0.6016 -0.5083 -0.6016 -1.0969 0.6016 -0.5082 -0.6016 -1.0969 0 0.6016 -0.5082 -0.6016 -1.0969 0.7558 -0.2800 0.2442 0.2675 0 0.7558 -0.2800 -0.7558 -1.2295 0 0.7558 -0.2800 -0.7558 -1.2295 2 0.9495 -0.0518 1.0505 0.9374 0 0.9495 -0.0518 -0.9495 -1.3781 0.9495 -0.0518 0.0505 0.0513 1 1.1929 0.1764 -0.1929 -0.1818
Step by Step Solution
There are 3 Steps involved in it

Get step-by-step solutions from verified subject matter experts