

Question: Create a scatterplot for the following data: x Y 0.13 645 0.27 486 0.49 435 0.57 689 0.84 137 0.64 167
Create a scatterplot for the following data:
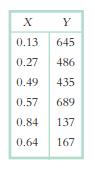
x Y 0.13 645 0.27 486 0.49 435 0.57 689 0.84 137 0.64 167
Step by Step Solution
There are 3 Steps involved in it
1 Expert Approved Answer
Step: 1 Unlock

Question Has Been Solved by an Expert!
Get step-by-step solutions from verified subject matter experts
Step: 2 Unlock
Step: 3 Unlock