

Question: Conduct a two-sample t test on the data, but assume unequal variances. How did the results change? Why? The dataset given in Table 7.8 shows
Conduct a two-sample t test on the data, but assume unequal variances. How did the results change? Why?
The dataset given in Table 7.8 shows the monthly shrink rates in stores 1 and 2. Use this dataset (Table 7.8) for this exercise.
Table 7.8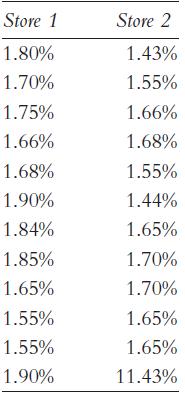
Store 1 1.80% 1.70% 1.75% 1.66% 1.68% 1.90% 1.84% 1.85% 1.65% 1.55% 1.55% 1.90% Store 2 1.43% 1.55% 1.66% 1.68% 1.55% 1.44% 1.65% 1.70% 1.70% 1.65% 1.65% 11.43%
Step by Step Solution
★★★★★
3.35 Rating (155 Votes )
There are 3 Steps involved in it
1 Expert Approved Answer
Step: 1 Unlock

Question Has Been Solved by an Expert!
Get step-by-step solutions from verified subject matter experts
Step: 2 Unlock
Step: 3 Unlock