

As reported in Table 5.1, the mean SAT reading score was 485 with a standard deviation of
Question:
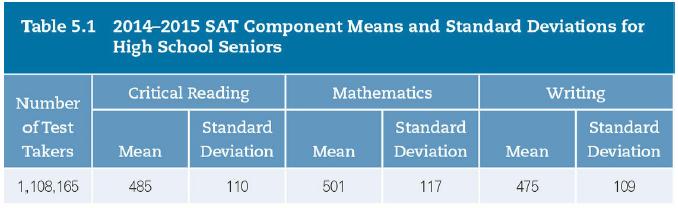
As reported in Table 5.1, the mean SAT reading score was 485 with a standard deviation of 110 in 2014–2015.
1. What percentage of students scored above 625?
2. What percentage of students scored between 400 and 625?
3. A college decides to liberalize its admission policy. As a first step, the admissions committee decides to exclude student applicants scoring below the 20th percentile on the reading SAT. Translate this percentile into a Z score. Then, calculate the equivalent SAT reading test score.
Table 5.1
Fantastic news! We've Found the answer you've been seeking!
Step by Step Answer:
Part a X N 485 110 P X 625 1 P X 625 Standardizing the value Z X Z ...View the full answer

Answered By
Marvine Ekina
Marvine Ekina
Dedicated and experienced Academic Tutor with a proven track record for helping students to improve their academic performance. Adept at evaluating students and creating learning plans based on their strengths and weaknesses. Bringing forth a devotion to education and helping others to achieve their academic and life goals.
PERSONAL INFORMATION
Address: , ,
Nationality:
Driving License:
Hobbies: reading
SKILLS
????? Problem Solving Skills
????? Predictive Modeling
????? Customer Service Skills
????? Creative Problem Solving Skills
????? Strong Analytical Skills
????? Project Management Skills
????? Multitasking Skills
????? Leadership Skills
????? Curriculum Development
????? Excellent Communication Skills
????? SAT Prep
????? Knowledge of Educational Philosophies
????? Informal and Formal Assessments
0 Reviews
10+ Question Solved
Related Book For 
Social Statistics For A Diverse Society
ISBN: 9781506347202
8th Edition
Authors: Chava Frankfort Nachmias, Anna Y. Leon Guerrero
Question Posted:
