

Question: The table below contains T c values for different isotopically enriched samples of Sn and Hg. Assuming T c M , determine
The table below contains Tc values for different isotopically enriched samples of Sn and Hg. Assuming Tc ∝ M−α , determine α in each case. Give a short explanation of why Tc depends on the isotopic mass. Sn data are from ref. [30]; Hg data are from ref. [6].
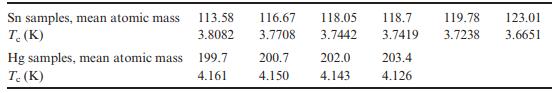
Sn samples, mean atomic mass 113.58 T. (K) 3.8082 Hg samples, mean atomic mass T. (K) 199.7 4.161 116.67 118.05 3.7708 3.7442 200.7 4.150 202.0 4.143 119.78 123.01 118.7 3.7419 3.7238 3.6651 203.4 4.126
Step by Step Solution
3.35 Rating (161 Votes )
There are 3 Steps involved in it
The data show that there is a decrease in T c as the mass M increases A plot of logT ... View full answer

Get step-by-step solutions from verified subject matter experts