

Question: Use a program like Mathematica to create diagrams analogous to Figures 1.13 and 1.14 showing the location of the atoms for the last four crystal
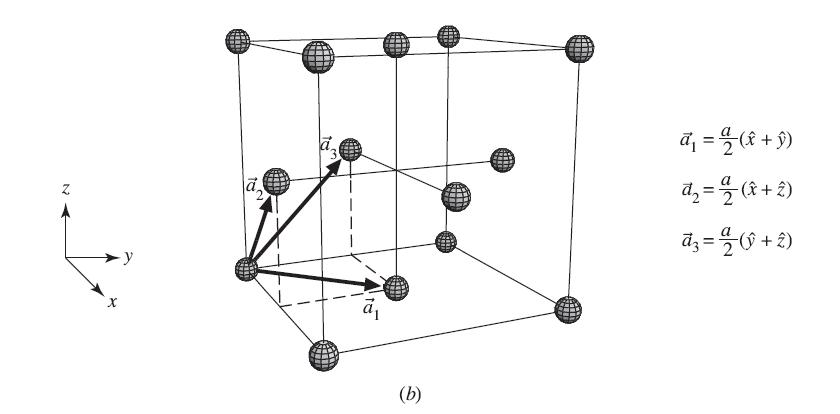
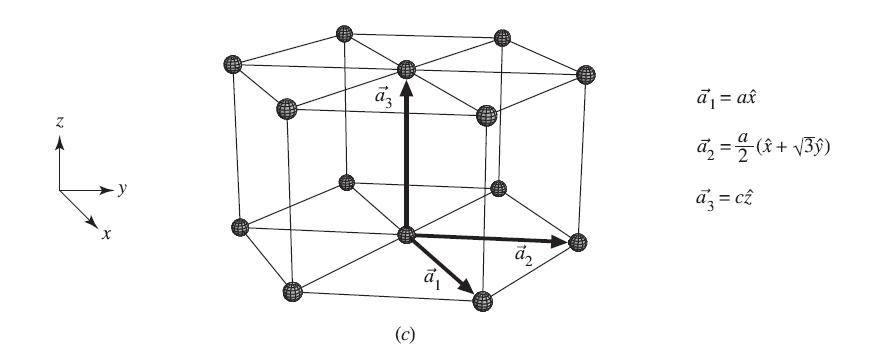
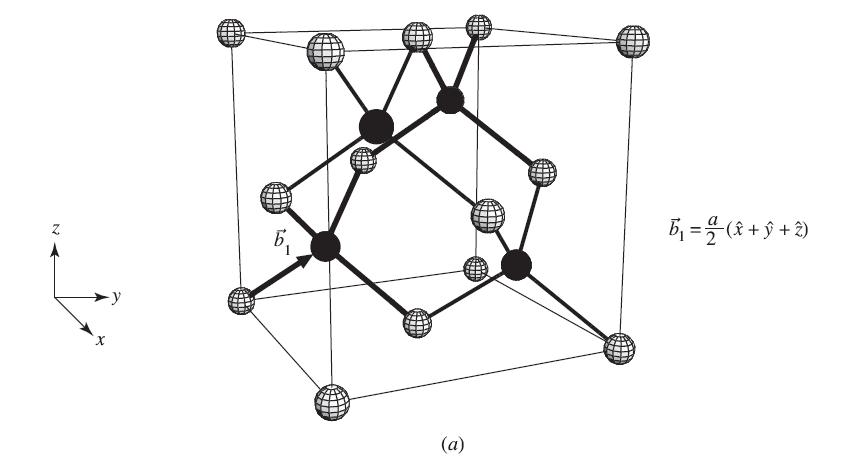
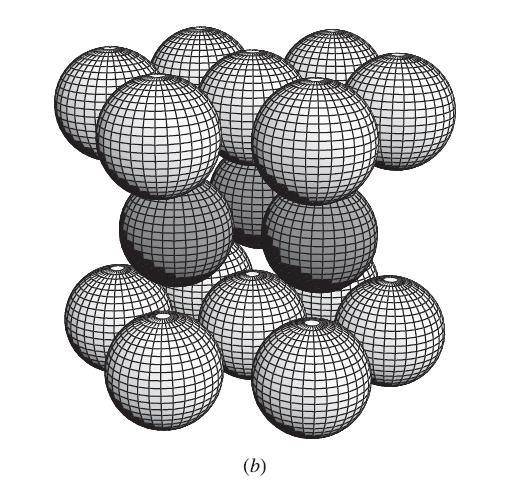
Use a program like Mathematica to create diagrams analogous to Figures 1.13 and 1.14 showing the location of the atoms for the last four crystal structures from Table 1.1. (In Mathematica, it is simple to create a set of spheres of radius r centered at points {x1, y1, z1}, {x2, y2, z2}, . .. using the command![Show[Graphics3D[Sphere[{{x, Y,2}, {X2, Y2, 22},...}], rll](https://dsd5zvtm8ll6.cloudfront.net/si.question.images/images/question_images/1691/7/5/6/87264d62948030771691756870953.jpg)
Try using different viewpoint positions in the plotting. How many nearest neighbors does each atom have?
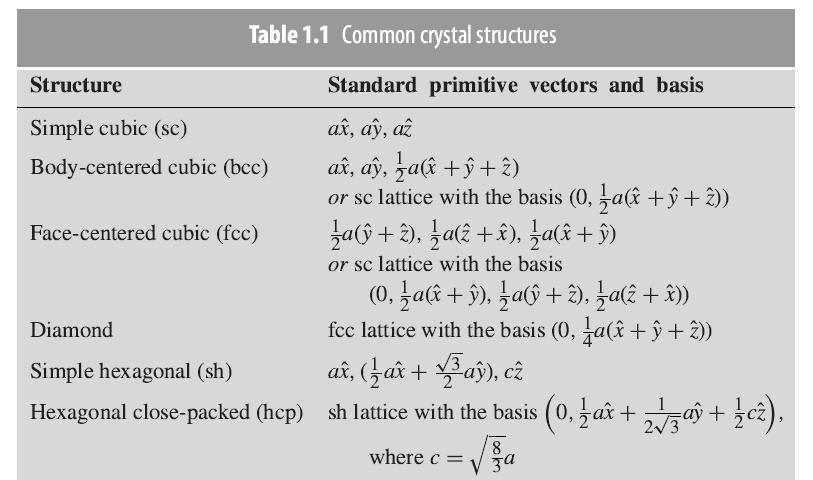
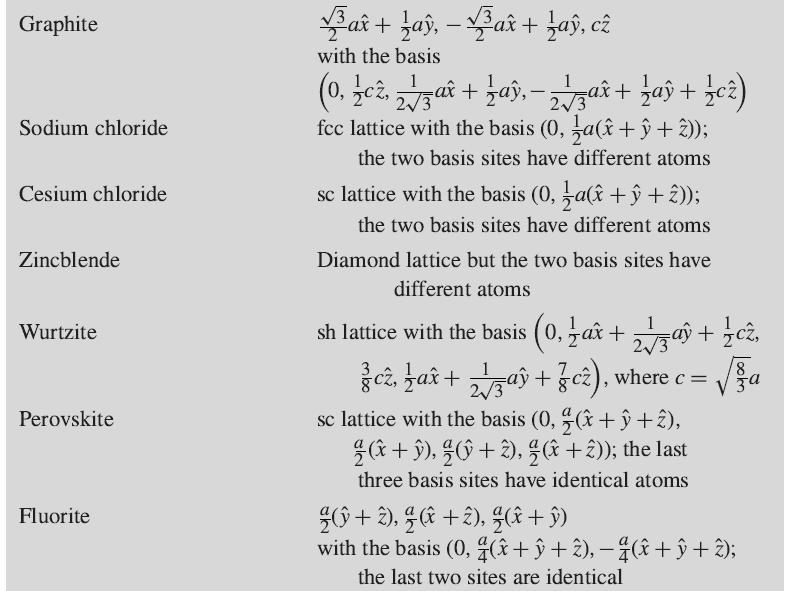
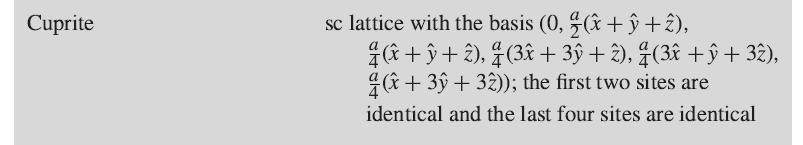
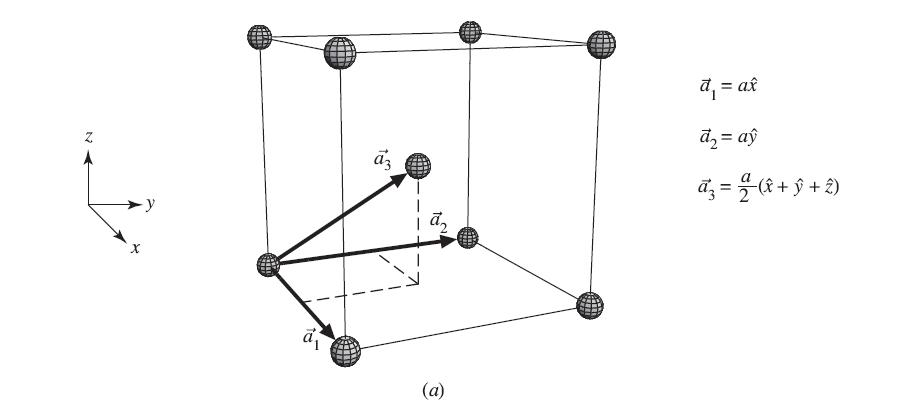
Fig. 1.13
Figures 1.14
Show[Graphics3D[Sphere[{{x, Y,2}, {X2, Y2, 22},...}], rll
Step by Step Solution
3.46 Rating (166 Votes )
There are 3 Steps involved in it
The lattices in the figures were generated by the Mathematica code below There ... View full answer

Get step-by-step solutions from verified subject matter experts