

Question: (a) Generate 10,000 random variables following the beta ((5,5)), the beta ((0.8,0.8)), the beta ((0.8,5)), the beta ((5,2)), the beta ((2,5)), and the beta( (5,0.8))
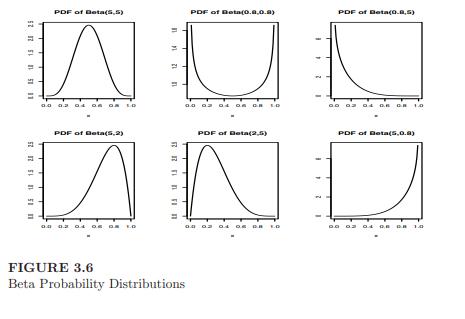
(a) Generate 10,000 random variables following the beta \((5,5)\), the beta \((0.8,0.8)\), the beta \((0.8,5)\), the beta \((5,2)\), the beta \((2,5)\), and the beta( \(5,0.8)\) distributions.
Fit kernel densities to each one, and produce six plots of the empirical densities, similar to the mathematical densities in Figure 3.6.
(b) Generate 10,000 random variables following the generalized error distribution, with \(u=2\) (normal), \(u=1\) (double exponential), \(u=0.8\), and \(u=3\). (A function to do this is in the \(\mathrm{R}\) package fGarch.)
Fit kernel densities to each one, and produce four graphs of the empirical densities on the same plot, similar to the mathematical densities in Figure 3.8.
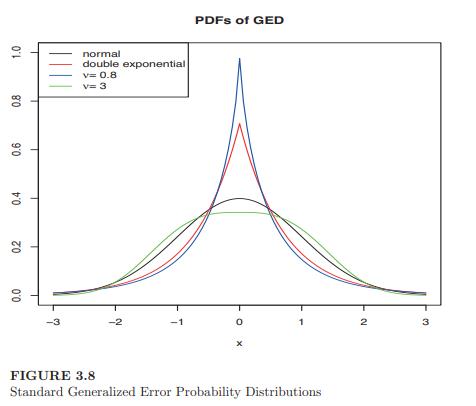
Produce a legend to identify the separate densities.
(c) Generate 10,000 random variables following the skewed normal distribution, with \(\xi=1\) (normal), \(\xi=1.5\), and \(\xi=2\).
Fit kernel densities to each one, and produce three graphs of the empirical densities on the same plot, similar to the mathematical densities in Figure 3.9.
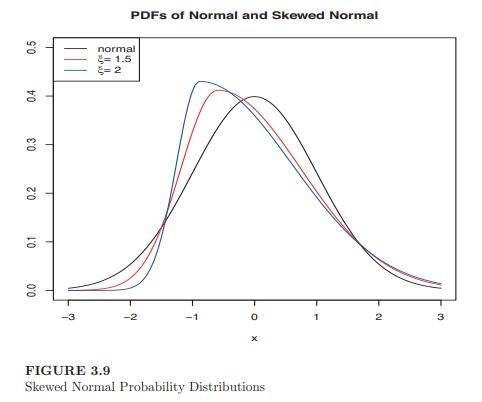
Produce a legend to identify the separate densities.
(d) Generate 10,000 random variables following each of the normal mixture distributions:
\[ \begin{gathered} 0.6 \mathrm{~N}(0,1)+0.4 \mathrm{~N}(0,9) \\ 0.6 \mathrm{~N}(0,1)+0.4 \mathrm{~N}(0,0.64) \\ 0.5 \mathrm{~N}(0,1)+0.5 \mathrm{~N}(3,1) \\ 0.9 \mathrm{~N}(0,1)+0.1 \mathrm{~N}(3,1) \end{gathered} \]
Fit kernel densities to each one, and produce six graphs of the empirical densities on the same plot, similar to the mathematical densities in Figure 3.10.
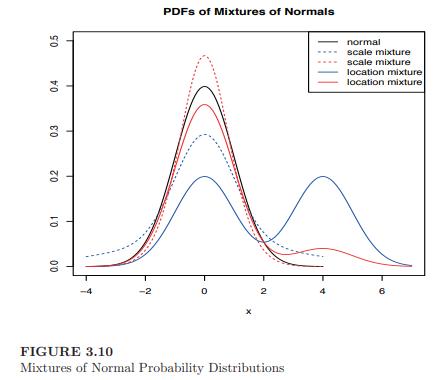
Produce a legend to identify the separate densities.
52 25 15111 15 10 15 20 25 PDF of Beta(5,5) PDF of Beta(0.8,0.8) PDF of Beta(0.8,5) PDF of Beta(5,2) 12 14 1 21 25 PDF of Beta(2,5) N PDF of Beta(5,0.8) FIGURE 3.6 Beta Probability Distributions TO CO GO
Step by Step Solution
3.26 Rating (152 Votes )
There are 3 Steps involved in it

Get step-by-step solutions from verified subject matter experts