

Question: (a) Generate four sets of ARIMA data using the same models as used to produce the series shown in Figure 5.13, except for the innovations,
(a) Generate four sets of ARIMA data using the same models as used to produce the series shown in Figure 5.13, except for the innovations, use a t distribution with 5 degrees of freedom.
Plot the four series in a manner similar to Figure 5.13, in which a normal distribution was used.
Comment on the differences in your plots and the plots in Figure 5.13.
(b) As in Exercise 5.25a, generate 500 values of an \(\operatorname{ARIMA}(2,1,2)\) process, except with innovations following a t with \(5 \mathrm{df}\). (This can be one of the sets generated in Exercise 5.26a.) Produce a time series plot of the differenced values. Does the differenced series appear to be stationary?
(c) Now fit both the original series and the differenced series using auto. arima with both the AIC and the BIC. What models are chosen?
(d) Fit the data generated using the "correct" model, and compute the residuals from the fitted model.
Make two q-q plots of the residuals, one using a normal reference distribution and one using a t with \(5 \mathrm{df}\).
Figure 5.13: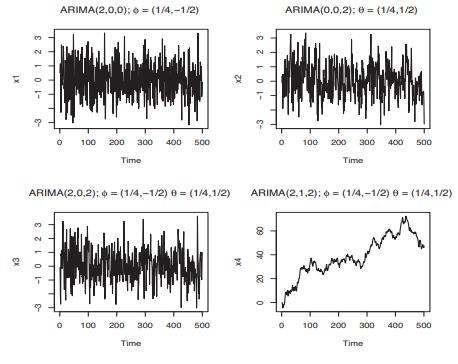
x1 -1 0 1 2 3 ARIMA(2,0,0); = (1/4,-1/2) 0 100 200 300 400 500 Time x2 -3 -1 0 1 2 3 ARIMA(0,0,2); 0 = (1/4,1/2) 100 200 300 400 500 Time ARIMA(2,0,2); 0 = (1/4,-1/2) = (1/4,1/2) ARIMA(2,1,2); = (1/4,-1/2) = (1/4,1/2) x3 -3 -1 0 1 2 3 100 200 300 Time x4 40 & 09 400 500 0 100 200 300 400 500 Time
Step by Step Solution
3.38 Rating (154 Votes )
There are 3 Steps involved in it

Get step-by-step solutions from verified subject matter experts