Obtain the daily closing prices of the S&P 500 Index for the year 2017 and compute the
Question:
Obtain the daily closing prices of the S\&P 500 Index for the year 2017 and compute the daily returns.
(a) Compute the standard deviation (the volatility), the MAD, and the IQR of the returns.
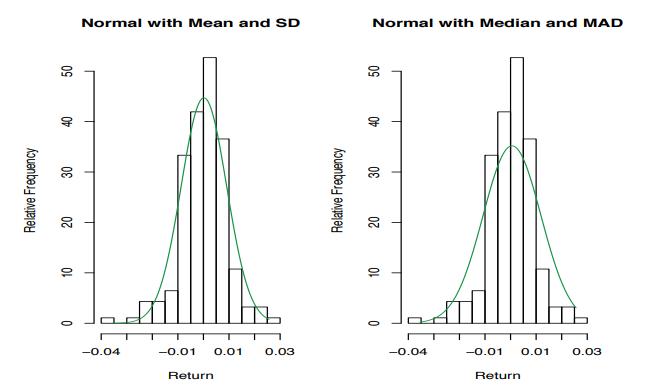
(b) Now produce two side-by-side histograms with normal probability density curves superimposed, where for one the normal density has mean equal to the sample mean and standard deviation equal to the sample standard deviation, and for the other one the normal density has mean equal to the sample median and standard deviation based on the MAD (see equation (1.64)). Your plots should be similar to those in Figure 4.5. Which one seems to fit better? Does this mean that the normal distribution may be a good model for returns if the appropriate mean and variance are used?
\(\sigma \approx 1.48 \mathrm{MAD} . \tag{1.64}\)
FIGURE 4.5:
Step by Step Answer: