

Question: We emphasized the importance of recognizing whether time is a fundamental component of data, and we suggested a simple plot, illustrated in Figure 2.3 to
We emphasized the importance of recognizing whether time is a fundamental component of data, and we suggested a simple plot, illustrated in Figure 2.3 to use to decide how important time may be.
Generally, we know that price data on a stock are highly dependent on time, but the returns on a stock are not so dependent on time, although their frequency distribution may vary over time.
(a) For the NFLX daily closes in the first calendar quarter of 2018 , produce a scatterplot of the lagged daily prices versus the prices.
Are these data similar to a random walk?
(b) Produce a scatterplot of the lagged daily returns versus the returns of NFLX for the first calendar quarter 2018. Are these data similar to a random walk? Do there appear to be other time dependencies?
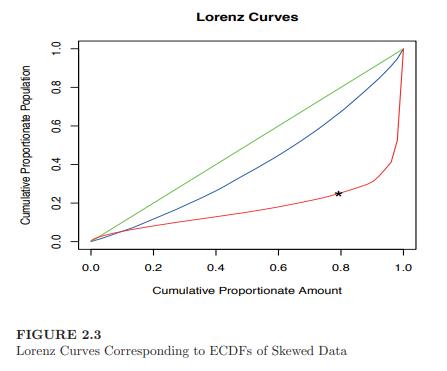
Cumulative Proportionate Population 0.0 0.2 0.4 0.6 0.8 1.0 Lorenz Curves 0.0 0.2 0.4 0.6 0.8 1.0 Cumulative Proportionate Amount FIGURE 2.3 Lorenz Curves Corresponding to ECDFs of Skewed Data
Step by Step Solution
There are 3 Steps involved in it

Get step-by-step solutions from verified subject matter experts