

Question: Listed below (in order by row) are annual high values of the Dow Jones Industrial Average from 1995 through 2015. Construct a time-series line chart
Listed below (in order by row) are annual high values of the Dow Jones Industrial Average from 1995 through 2015. Construct a time-series line chart of the data. Comment on the result.
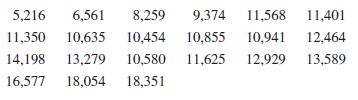
11,401 5,216 6,561 8,259 9,374 11,568 11,350 10,635 10,454 10,855 10,941 12,464 11,625 12,929 13,589 14,198 13,279 10,580 16,577 18,054 18,351
Step by Step Solution
★★★★★
3.23 Rating (161 Votes )
There are 3 Steps involved in it
1 Expert Approved Answer
Step: 1 Unlock

The statetransition matrix is a matrix whose product with the state vector ... View full answer
Question Has Been Solved by an Expert!
Get step-by-step solutions from verified subject matter experts
Step: 2 Unlock
Step: 3 Unlock