

Question: Refer to Figure 3.37 in Exercise 15 and construct a bar chart to depict the same data in a way that is fair and objective.
Refer to Figure 3.37 in Exercise 15 and construct a bar chart to depict the same data in a way that is fair and objective.
Figure 3.37
Exercise 15
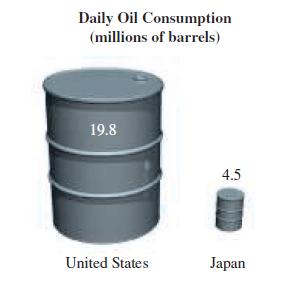
Figure 3.37 depicts the amounts of daily oil consumption (in millions of barrels) in the United States and Japan. Does the illustration accurately depict the data? Why or why not?
Daily Oil Consumption (millions of barrels) 19.8 4.5 United States Japan
Step by Step Solution
★★★★★
3.35 Rating (173 Votes )
There are 3 Steps involved in it
1 Expert Approved Answer
Step: 1 Unlock

Answer The illustration does not accurately depict the dat... View full answer
Question Has Been Solved by an Expert!
Get step-by-step solutions from verified subject matter experts
Step: 2 Unlock
Step: 3 Unlock