

Question: 13.20. Table 13.21 shows output for GSS data with y = index of attitudes toward premarital, extramarital, and homosexual sex, for which higher scores represent
13.20. Table 13.21 shows output for GSS data with y =
index of attitudes toward premarital, extramarital, and homosexual sex, for which higher scores represent more permissive attitudes. The categorical explanatory variables are race (0 for whites, 1 for blacks), gender (0 for males, 1 for females), region (0 for South, 1 for non-
South), and religion (r1 = 1 for liberal Protestant sect, r2 = 1 for conservative Protestant, r3 = 1 for fundamentalist Protestant sect, r4 = 1 for Catholic, r5 = 1 for Jewish;
no religious affiliation when r1 = · · · = r5 = 0).
The quantitative explanatory variables are age, education
(number of years), attendance at church (higher values represent more frequent attendance), and a variable for which higher values represent greater intolerance of freedom of speech for atheists and communists.
(a) Based on the parameter estimates, give a profile of a person you would expect to be (i) least permissive,
(ii) most permissive, with respect to sexual attitudes.
(b) Summarize your main conclusions from studying the output.
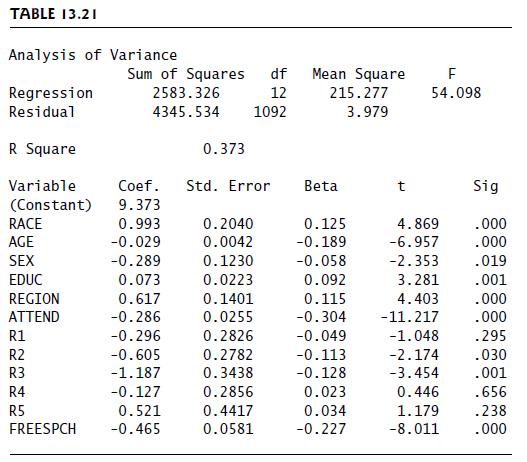
TABLE 13.21 Analysis of Variance Sum of Squares df Mean Square F Regression 2583.326 12 Residual 4345.534 1092 215.277 3.979 54.098 R Square 0.373 Variable Coef. Std. Error Beta t Sig (Constant) 9.373 RACE 0.993 0.2040 0.125 4.869 .000 AGE -0.029 0.0042 -0.189 -6.957 .000 SEX -0.289 0.1230 -0.058 -2.353 .019 EDUC 0.073 0.0223 0.092 3.281 .001 REGION 0.617 0.1401 0.115 4.403 .000 ATTEND -0.286 0.0255 -0.304 -11.217 .000 R1 -0.296 0.2826 -0.049 -1.048 .295 R2 -0.605 0.2782 -0.113 -2.174 .030 R3 -1.187 0.3438 -0.128 -3.454 .001 R4 -0.127 0.2856 0.023 0.446 .656 R5 0.521 0.4417 0.034 1.179 .238 FREESPCH -0.465 0.0581 -0.227 -8.011 .000
Step by Step Solution
There are 3 Steps involved in it

Get step-by-step solutions from verified subject matter experts