

Question: 13.19. For the 2014 GSS, Table 13.20 shows estimates (with se values in parentheses) for four regression models for y = political party identification in
13.19. For the 2014 GSS, Table 13.20 shows estimates
(with se values in parentheses) for four regression models for y = political party identification in the United States, scored from 1 = strong Democrat to 7 = strong Republican.
The explanatory variables are sex (0 = male, 1 = female), race (0 = white, 1 = black), religion (scored 1 =
fundamentalist, 2 = moderate, 3 = liberal), and political views (scored from 1 = extremely liberal to 7 = extremely conservative). Summarize your main conclusions from these model fits in a report of about 200 words.
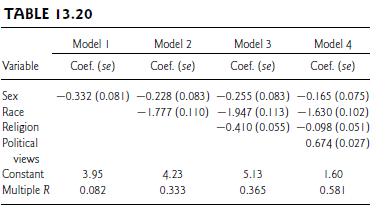
TABLE 13.20 Model I Variable Coef. (se) Model 2 Coef. (se) Model 3 Model 4 Coef. (se) Coef. (se) Sex Race Religion -0.332 (0.081) -0.228 (0.083) -0.255 (0.083) -0.165 (0.075) -1.777 (0.110)-1.947 (0.113) -1.630 (0.102) -0.410 (0.055) -0.098 (0.051) Political 0.674 (0.027) views Constant 3.95 4.23 5.13 1.60 Multiple R 0.082 0.333 0.365 0.581
Step by Step Solution
There are 3 Steps involved in it

Get step-by-step solutions from verified subject matter experts