

Question: Below are three graphs showing data points for independent and related dependent variables. a. Draw a rough approximation of the regression line for each, A
Below are three graphs showing data points for independent and related dependent variables.
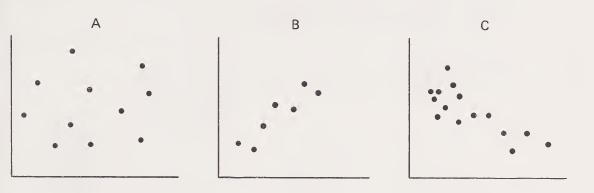
a. Draw a rough approximation of the regression line for each, A to G (Y= a + bX).
b. Identify the graph with a coefficient of correlation near zero. What causes a coefficient to be near zero ?
c. Identify the graph with a negative slope. Provide an example where regression could be used in auditing in which there is likely to be a negative slope.
d. Assuming both the X and Y axes for all three graphs use the same scale, which graph is likely to have the largest standard deviation? Which is likely to have the smallest precision interval ? Explain the reasons for your answers.
e. In which graph is
a, in the straight-line formula Y = a + bX, likely to be near zero ? Provide an example where regression could be used in auditing in which a is likely to have a zero value.
f. Identify the graph in which curvilinear regression is likely to provide a significantly improved coefficient of correlation.
g. Identify the graph in which multiple correlation provides the greatest application for a smaller confidence interval.
B
Step by Step Solution
There are 3 Steps involved in it

Get step-by-step solutions from verified subject matter experts