

Question: Exercise 11.11 showed a regression analysis for statewide data on y = violent crime rate, x1 = poverty rate, and x2 = percentage living in
Exercise 11.11 showed a regression analysis for statewide data on y = violent crime rate, x1 = poverty rate, and x2 = percentage living in urban areas. When we add an interaction term, we get ˆy = 158.9 − 14.72x1 −
1.29x2 + 0.76x1x2.
(a) As the percentage living in urban areas increases, does the effect of poverty rate tend to increase or decrease?
Explain.
(b) Show how to interpret the prediction equation, by finding how it simplifies when x2 = 0, 50, and 100.
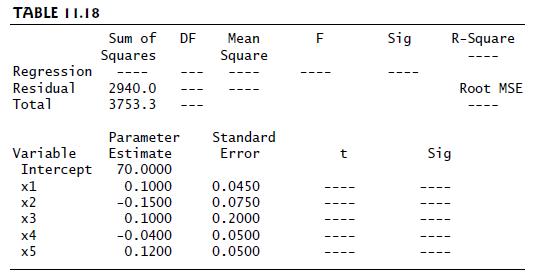
TABLE 11.18 Sum of DF Squares Mean Square Sig R-Square Regression Residual 2940.0 Root MSE Total 3753.3 Parameter Standard Variable Estimate Error Sig Intercept 70.0000 x1 0.1000 0.0450 x2 -0.1500 0.0750 x3 0.1000 0.2000 x4 -0.0400 0.0500 x5 0.1200 0.0500
Step by Step Solution
There are 3 Steps involved in it

Get step-by-step solutions from verified subject matter experts