

Question: Table 10.6 relates occupational level (white collar, blue collar) and political party choice, controlling for income. (a) Construct the bivariate table between occupational level and
Table 10.6 relates occupational level (white collar, blue collar) and political party choice, controlling for income.
(a) Construct the bivariate table between occupational level and political party, ignoring income. Is there an association? If so, describe it.
(b) Do the partial tables display an association? Interpret them.
(c) Using the nature of the association between income and each of the other variables, explain why the bivariate table has such different association than the partial tables.
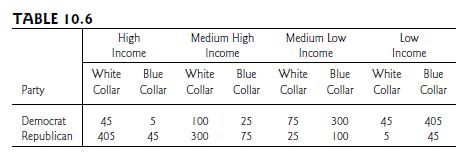
(d) Construct a chain diagram that might explain the relationships, identifying the intervening (i.e., mediator)
variable.
(e) Show that the data are also consistent with a spurious association, and draw the corresponding diagram. Which diagram seems more appropriate?Why?
TABLE 10.6 High Income Medium High Income Medium Low Income Low Income White Blue White Blue White Blue White Blue Party Collar Collar Collar Collar Collar Collar Collar Collar Democrat 45 5 100 25 75 300 45 405 Republican 405 45 300 75 25 100 5 45
Step by Step Solution
There are 3 Steps involved in it

Get step-by-step solutions from verified subject matter experts