

Question: The following MINITAB output presents a confidence interval for a population mean. a. How many degrees of freedom does the Students t distribution have? b.
The following MINITAB output presents a confidence interval for a population mean.
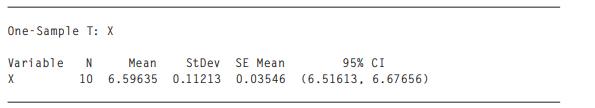
a. How many degrees of freedom does the Student’s t distribution have?
b. Use the information in the output, along with the t table, to compute a 99% confidence interval.
One-Sample T: X Variable N X StDev SE Mean 0.03546 95% CI (6.51613, 6.67656) Mean 10 6.59635 0.11213
Step by Step Solution
There are 3 Steps involved in it
1 Expert Approved Answer
Step: 1 Unlock

Question Has Been Solved by an Expert!
Get step-by-step solutions from verified subject matter experts
Step: 2 Unlock
Step: 3 Unlock