A plant manager wants to estimate how the number of units produced at a plant is affected
Question:
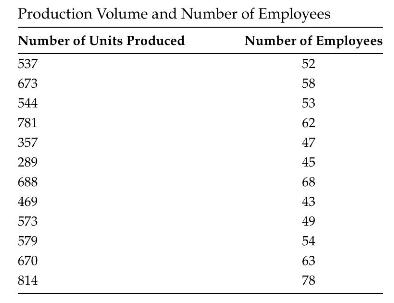
A plant manager wants to estimate how the number of units produced at a plant is affected by the number of employees. The data in Table 7.9 gives a random sample of the number of units produced and the number of employees.
a. Which variable is the response variable and which is the predictor variable?
b. Draw a scatterplot and find the equation of the line of best fit that models the relationship between the number of units produced and the number of employees working.
c. Interpret whether or not you believe there is a significant relationship between the number of units produced and the number of employees working.
d. Find and interpret the coefficient of determination.
e. Check any relevant model assumptions and identify any outliers.
f. Find and interpret a confidence interval for the true population slope parameter.
g. Find and interpret a confidence interval for the predicted number of units produced when 50 employees are working.
h. Find and interpret a confidence interval for the mean number of units produced when 50 employees are working.
Table 7.9
Step by Step Answer:

This question has not been answered yet.
You can Ask your question!